

Astragalus mongholicus polysaccharides alleviate insulin resistance through modulation of PI3K/ AKT, TLR4/ NF-kB signaling pathway and microbiota in rats with Type 2 Diabetes Mellitus
- PMID: 40486274
- PMCID: PMC12143329
- DOI: 10.1016/j.jtcme.2024.05.007
Astragalus mongholicus polysaccharides alleviate insulin resistance through modulation of PI3K/ AKT, TLR4/ NF-kB signaling pathway and microbiota in rats with Type 2 Diabetes Mellitus
Abstract
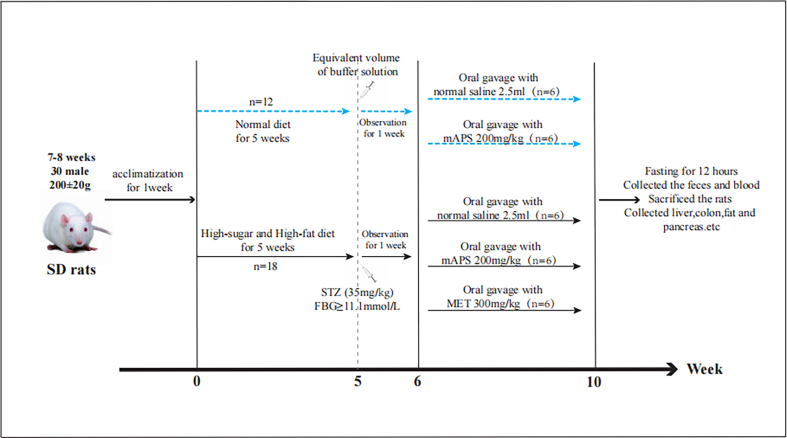
Background and aim: Astragali Radix has been widely used in traditional Chinese medicine to treat diabetes and a variety of other diseases. This study aims to evaluate the alleviating effects and mechanisms of Astragalus mongholicus Polysaccharide (mAPS) against diet combined with streptozotocin (STZ)-induced Type 2 Diabetes Mellitus (T2DM).
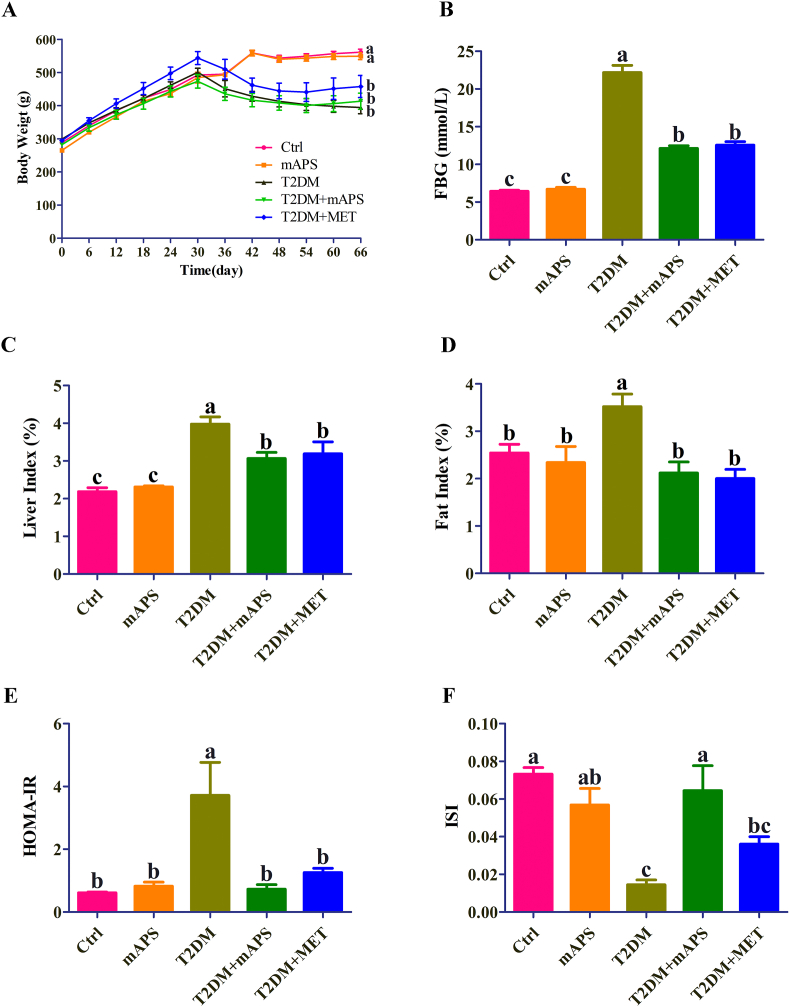
Experimental procedure: T2DM rats were orally administrated either with 200 mg/kg mAPS or 300 mg/kg Metformin (MET) once daily for four weeks. Body weight and Fasting Blood Glucose (FBG) were detected every 6 days. Serum fasting insulin (FINS) was measured by ELISA and the homeostatic model assessment of insulin resistance (HOMA-IR) was calculated accordingly. Histological change was studied by Hematoxylin and eosin (HE) staining. 16S rDNA sequencing was used to detect the changes in gut microbiota.
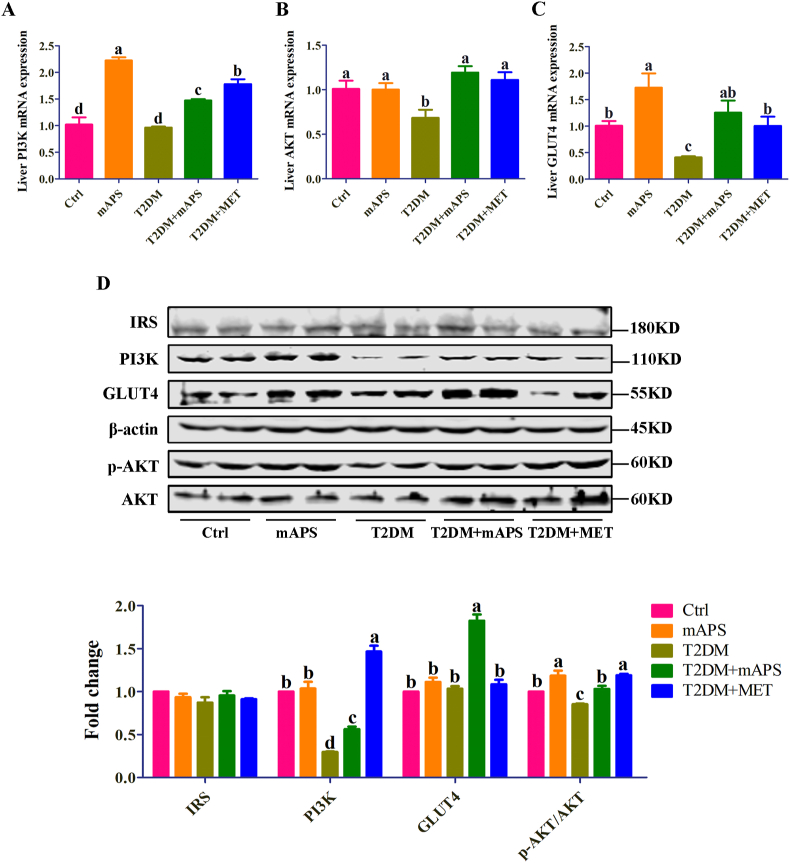
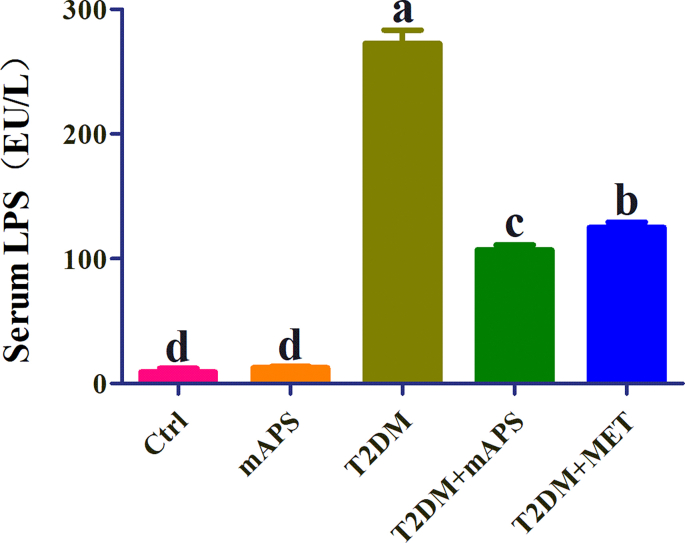
Results and conclusion: Oral administration of mAPS significantly decreased body weight, FBG, and HOMA-IR in T2DM rats (p<0.05). Moreover, HE staining showed that mAPS could alleviate histological distortion in the liver and pancreas. Treatment with mAPS elevated the hepatic levels of phosphatidylinositol-3 kinase (PI3K), phospho-protein kinase B (AKT), and glucose transporter type 4 (GLUT4), while reducing phospho-nuclear factor kappa-B (NF-κB), Toll-like receptor 4 (TLR4), tumor necrosis factor-α (TNF-α), interleukin-6 (IL-6), and interleukin-1β (IL-1β) (p<0.05). Furthermore, mAPS supplementation could reverse the ratio of Firmicutes/Bacteroidetes (F/B) and reduce the abundance of Clostridia and Proteobacteria (p<0.05). These results indicate that mAPS have the potential to enhance insulin sensitivity in diabetic rats by modifying gut microbiota and controlling the hepatic glycolipid metabolism and inflammation.
Keywords: Astragalus mongholicus polysaccharides; Gut microbiota; Insulin resistance; PI3K/AKT; T2DM.
© 2024 Center for Food and Biomolecules, National Taiwan University. Production and hosting by Elsevier Taiwan LLC.
Conflict of interest statement
The authors declare that they have no known competing financial interests or personal relationships that could have appeared to influence the work reported in this paper.
Figures


References
-
- DeFronzo R.A., Ferrannini E., Groop L., et al. Type 2 diabetes mellitus. Nat Rev Dis Prim. 2015;1 - PubMed
-
- Cho N.H., Shaw J.E., Karuranga S., et al. IDF Diabetes Atlas: global estimates of diabetes prevalence for 2017 and projections for 2045. Diabetes Res Clin Pract. 2018;138:271–281. - PubMed
-
- Qi B., Ren D., Li T., et al. Fu Brick tea manages HFD/STZ-Induced type 2 diabetes by regulating the gut microbiota and activating the IRS1/PI3K/Akt signaling pathway. J Agric Food Chem. 2022;70(27):8274–8287. - PubMed
LinkOut - more resources
Full Text Sources
Miscellaneous