. 2025 May 23:16:1596451.
doi: 10.3389/fimmu.2025.1596451. eCollection 2025.

NMB promotes the progression of colorectal cancer by regulating the NF-κB/P65 signaling pathway

Affiliations

NMB promotes the progression of colorectal cancer by regulating the NF-κB/P65 signaling pathway

Jiaxin Fan et al. Front Immunol. .

Abstract

Background: Colorectal carcinoma (CRC) ranks as the fourth most prevalent malignancy globally. Neuromedin B (NMB) and its corresponding receptor have been implicated in the pathogenesis of multiple neoplastic conditions. Nevertheless, the specific involvement of NMB in CRC progression remains poorly characterized.

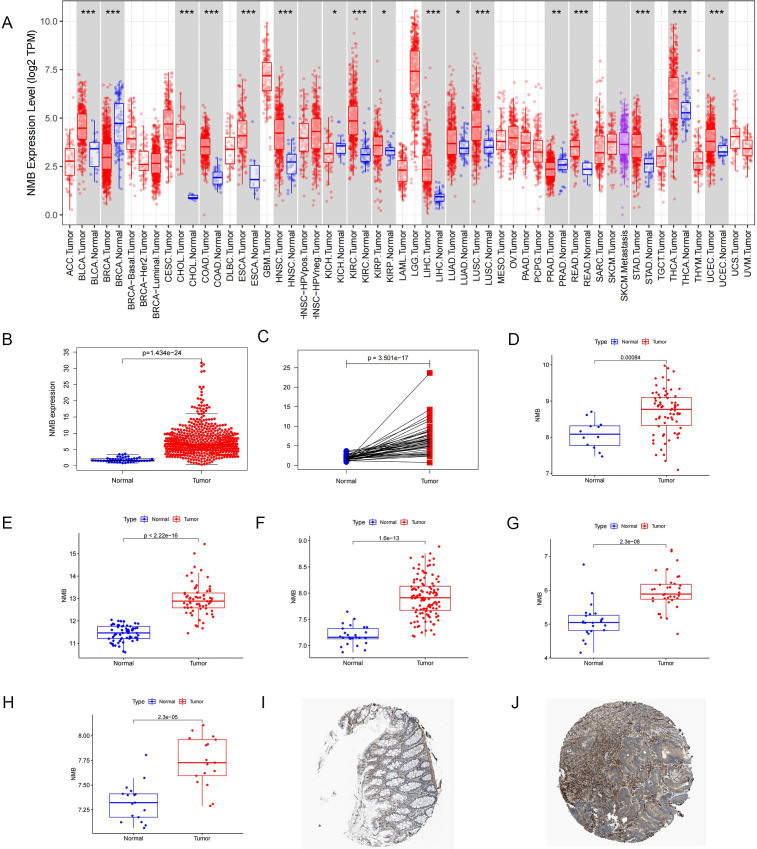
Methods: To investigate the differential expression of NMB, data were extracted from the TCGA and GEO databases, supplemented by tissue microarrays derived from clinical specimens. Prognostic significance was assessed through Kaplan-Meier survival analysis, ROC curve evaluation, Cox proportional hazards regression, clinical correlation studies, and nomogram construction. Experimental validation of NMB expression in CRC was performed using qRT-PCR, western blotting, immunohistochemistry, and ELISA techniques. Functional characterization of NMB's tumor-regulatory capacity was conducted through colony formation assays, MTT proliferation tests, wound healing experiments, and transwell migration/invasion assays. Mechanistic insights were obtained by identifying upstream regulatory proteins via co-immunoprecipitation and exploring potential signaling pathways through gene set enrichment analysis (GSEA) combined with western blot validation.

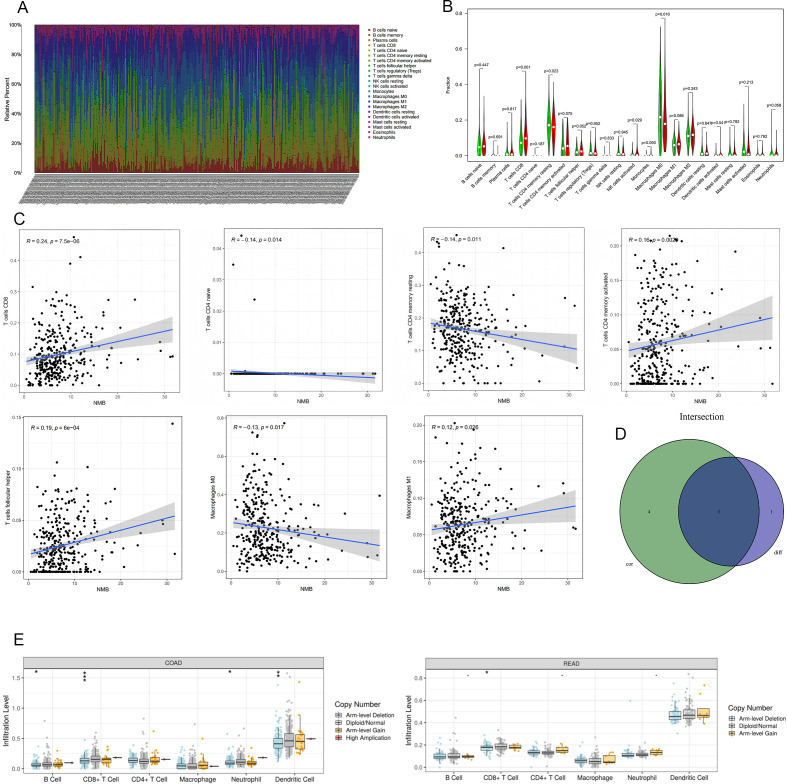
Results: Analysis of clinical data revealed that NMB exhibits markedly elevated expression levels in CRC tissues, with higher expression correlating significantly with poor prognosis. Receiver operating characteristic curve analysis validated NMB's utility as a reliable prognostic biomarker for survival outcomes. Importantly, multivariate Cox regression analysis demonstrated NMB's independent prognostic value in CRC patients. In vitro functional studies provided compelling evidence that NMB promotes CRC cell proliferation, migration, and invasive potential. Molecular investigations uncovered that NMB protein stability is regulated through USP21-dependent deubiquitination, leading to subsequent activation of the NF-κB signaling cascade and tumor progression. Notably, NMB expression patterns showed significant correlation with 5-fluorouracil resistance profiles, indicating its potential role in mediating chemotherapeutic response in CRC treatment regimens.

Conclusion: NMB exhibits significant overexpression in colorectal cancer, demonstrating promising potential as a dual-functional biomarker for both diagnostic identification and prognostic evaluation in CRC cases.

Keywords: NMB; biomarker; colorectal cancer; deubiquitination; prognosis.


Conflict of interest statement

The authors declare that the research was conducted in the absence of any commercial or financial relationships that could be constructed as a potential conflict of interest.

Figures

Figure 1
Figure 1
Analysis of NMB expression in database. Expression of NMB in pan-cancer from TCGA database (A). The relative expression level of NMB was found in 44 normal cases and 568 CRC tissues in the TCGA database (B). NMB expression was elevated in CRC tumor tissues compared to paired para-cancerous tissues (C). Difference Analysis of NMB expression based on 8 data sets in GEO Database, including GSE9348(D), GSE20482 (E), GSE21510 (F), GSE23878 (G), GSE32323 (H). Immunohistochemical analysis showed that the expression of NMB in CRC tissues was higher than that in normal colorectal tissues in HPA database (I, J) *P<0.05; **P<0.01; ***P<0.001.
Figure 2
Figure 2
Correlation analysis of NMB expression with prognosis and clinical features in the database. Survival analysis based on eight datasets from the GEO database, including GSE17536 (A), GSE17538 (B), GSE29623 (C), GSE38832 (D), GSE40967 (E), GSE71187 (F), GSE87211 (G), GSE103479 (H), and TCGA database(I). Meta-analysis of prognosis in patients with CRC (J). ROC curve for NMB expression, AUC of NMB at 1, 3, 5 years were 0.622, 0.576 and 0.669 (K). Univariate and multivariate cox regression analysis in the TCGA (L, M). *P<0.05; **P<0.01; ***P<0.001.
Figure 3
Figure 3
NMB expression is elevated and suggests a poor prognosis in CRC patients. The differential expression of NMB in CRC and normal colorectal tissues was analyzed by qRT-PCR and western bolt (n=6, p<0.001) (A, B). Immunohistochemical analysis of NMB in tissue (C-E). The expression of NMB in tissue homogenates and serum samples was detected by ELISA (F). KM curve analysis of 61 CRC patients (G). Correlation analysis of clinical features (H-K). Univariate and multifactorial COX analysis of OS in CRC patients (L-M).
Figure 4
Figure 4
Construction of prognostic model. Distribution of risk scores of high- and low-risk CRC patients (A). The K-M curve reflects that the OS of high-risk CRC patients is significantly lower than that of low-risk patients (P <0.001) (B). Calculate the scores of each item of CRC patients according to the nomogram, and the total scores obtained after addition can predict the 1-, 3- and 5-year survival probability (C). The 1-, 3- and 5-year calibration curve of the nomogram (D). The ROC curve of 1-, 3- and 5-year nomogram (AUC = 0.81 of 1 year, AUC = 0.82 of 3 years, AUC = 0.84 of 5 years) (E).
Figure 5
Figure 5
Verification of the role of NMB in the regulation of CRC in vitro. NMB regulates the proliferation, migration and invasion of CRC cells. Cloning experiment analysis (A). CCK-8 assay analysis (B). Experimental analysis of wound-healing assay (C). Experimental analysis of migration and invasion (D). *P<0.05; **P<0.01; ***P<0.001.
Figure 6
Figure 6
Relationship Between NMB Expression and Immune Infiltration in CRC. The number of immune cells in each sample (A). Results of differential analysis of immune cells. Green represents the low expression group and red represents the high expression group (B). NMB was significantly correlated with T cells CD8(R=0.24,p<0.001),T cells CD4 naive(R=-0.14,p=0.014),T cells CD4 memory resting(R=-0.14,p=0.011),T cells CD4 memory activated(R=0.16,p=0.0029),T cells follicular helper(R=0.19,p<0.001),Macrophages M0(R=-0.13,p=0.017) and Macrophages M1(R=0.12,p=0.026) (C);The intersection of the two test results (D). The relationships between infltration levels of 6 immune cells and copy number of NMB in CRC (E).*P<0.05; **P<0.01; ***P<0.001.
Figure 7
Figure 7
USP21 regulates the ubiquitin level of NMB. Western blot suggests that the expression in USP21 CRC tissue is higher than that in healthy colorectal tissue (n=6, p<0.001) (A). The expression of NMB decreased after knocking down USP21 in HCT116 cells (n=6, p<0.001) (B), In HCT116 cells, MG132 could reverse the decrease of NMB expression induced by knocking down USP21, but CQ had no effect (C). Co-IP suggested that USP21 could bind to NMB (D). Knocking down USP21 can increase the level of ubiquitin in NMB (E).
Figure 8
Figure 8
NMB affects the development of CRC by regulating NF-κB signal pathway. A merged enrichment plot from GSEA including enrichment score and gene sets (A). Western blot suggested that knocking down NMB could significantly reduce the phosphorylation of p65 at S536 site, and the total p65 decreased slightly (B). In the cell function test, the antitumor effect induced by knocking down NMB could be reversed by adding TNF (NF-K B activator). Including cloning experiment analysis (C), CCK-8 assay analysis (D), experimental analysis of wound-healing assay (E), experimental analysis of migration and invasion (F). *P<0.05; **P<0.01; ***P<0.001.
Figure 9
Figure 9
Drug sensitivity analysis. NMB co-expression genes in CRC cohort were identified by Linked Omics (A). Heatmaps showing top 50 genes positively and negatively correlated with NMB in CRC. Red dot, positively correlated gene; blue dot, negatively correlated genes (B). Correlation between NMB co-expression gene set and drug resistance, red indicates a positive correlation, and higher gene expression can lead to an increase in drug resistance, while blue indicates the opposite. (C).

Similar articles

References

    1. Wu S, Powers S, Zhu W, Hannun YA. Substantial contribution of extrinsic risk factors to cancer development. Nature. (2016) 529:43–7. doi: 10.1038/nature16166 - DOI - PMC - PubMed
    1. Russnes HG, Lønning PE, Børresen-Dale AL, Lingjærde OC. The multitude of molecular analyses in cancer: the opening of Pandora’s box. Genome Biol. (2014) 15:447. doi: 10.1186/s13059-014-0447-6 - DOI - PMC - PubMed
    1. Mullard A. Addressing cancer’s grand challenges. Nat Rev Drug discovery. (2020) 19:825–6. doi: 10.1038/d41573-020-00202-0 - DOI - PubMed
    1. Dekker E, Tanis PJ, Vleugels JLA, Kasi PM, Wallace MB. Colorectal cancer. Lancet (London England). (2019) 394:1467–80. doi: 10.1016/S0140-6736(19)32319-0 - DOI - PubMed
    1. Siegel RL, Miller KD, Jemal A. Cancer statistics, 2019. CA Cancer J Clin. (2019) 69:7–34. doi: 10.3322/caac.21551 - DOI - PubMed

LinkOut - more resources