. 2025 May 23:16:1515127.
doi: 10.3389/fimmu.2025.1515127. eCollection 2025.

C1q reprograms innate immune memory

Affiliations

C1q reprograms innate immune memory

Inge Jonkman et al. Front Immunol. .

Abstract

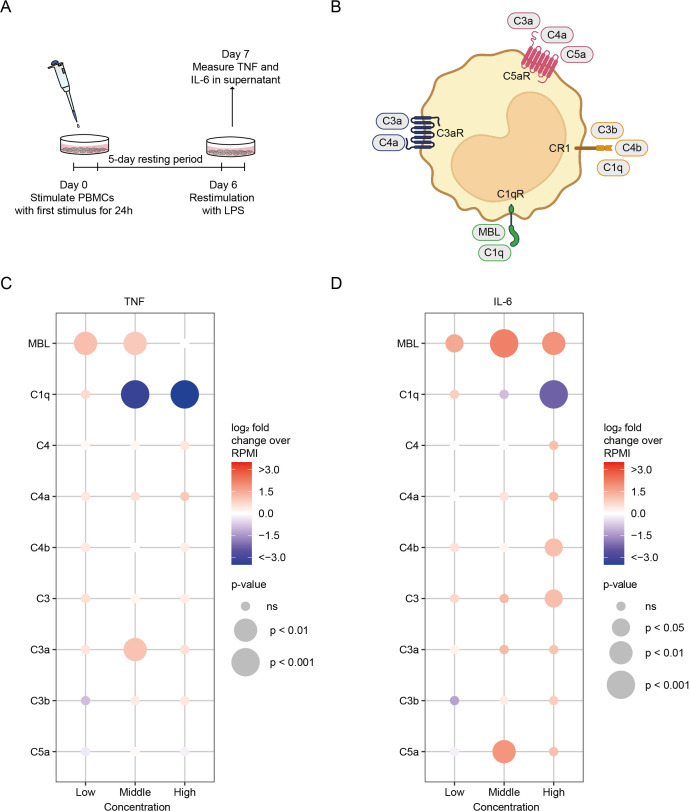
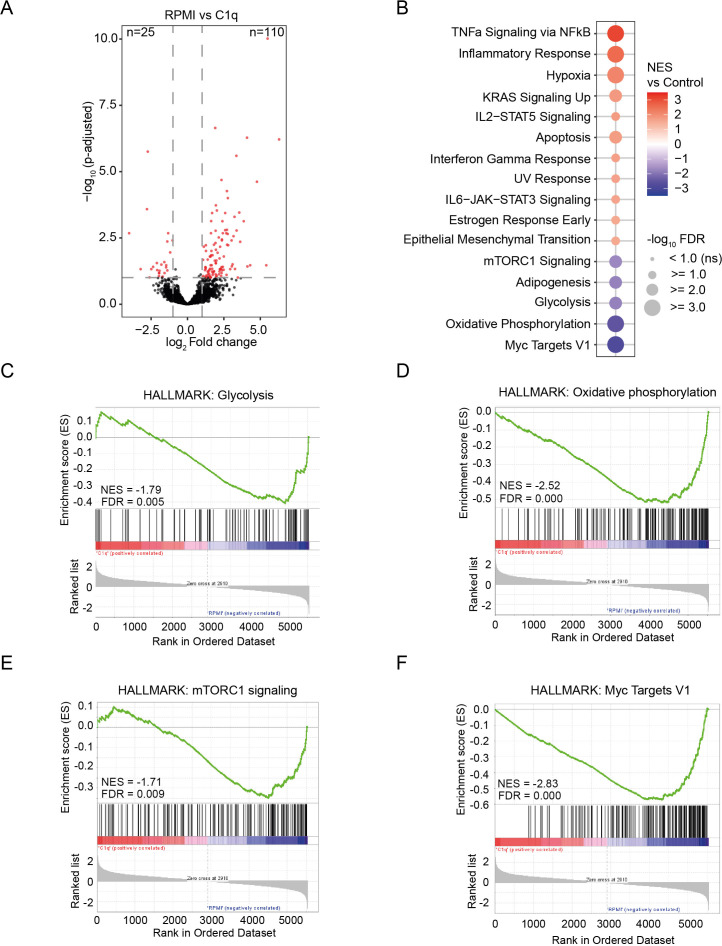
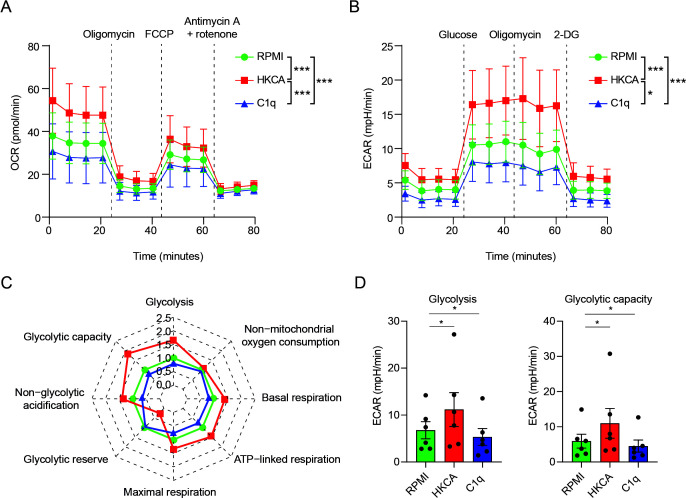
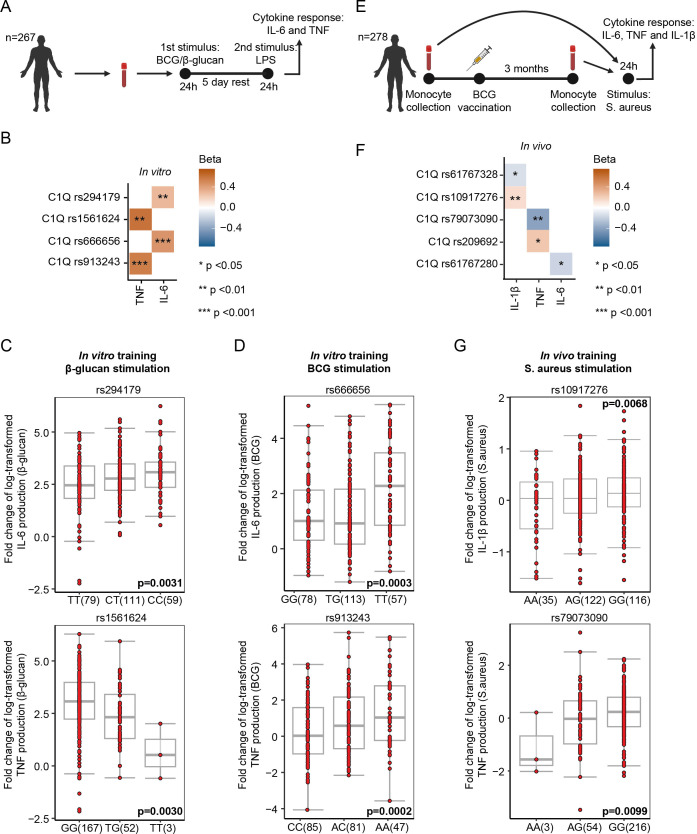
Innate immune memory, also called trained immunity, is a metabolic and epigenetically regulated process that enables innate immune cells to recalibrate their inflammatory reactivity in response to pathogenic or endogenous stimuli. In addition to its function in host defense, trained immunity contributes to diverse immune-mediated diseases. We discovered that complement component 1q (C1q) is an effective modulator of innate immune memory, potently suppressing the responsiveness of myeloid cells. We found that C1q leads to profound reprogramming of myeloid cell metabolism, particularly glycolysis, and exerts control over the transcriptional regulation of important metabolic and inflammatory genes. We corroborate our findings by identifying single-nucleotide polymorphisms close to the C1q gene that are linked to induction of trained immunity by Bacillus Calmette-Guérin (BCG) or beta-glucan in healthy peripheral blood mononuclear cells. Our results reveal an immunomodulatory role for C1q and provide evidence of a molecular interaction between the complement system and innate immune memory. These findings expand our understanding of innate immune memory.

Keywords: C1q; complement; immunometabolism; innate immune memory; tolerance; trained immunity.


Conflict of interest statement

WM is scientific founder of TTxD and Biotrip. LJ is scientific founder of TTxD, LembaTX and SalvinaTX. MN is scientific founder of TTxD, Biotrip, LembaTX, and SalvinaTX. The remaining authors declare that the research was conducted in the absence of any commercial or financial relationships that could be construed as a potential conflict of interest.

Figures

Figure 1
Figure 1
The effects of complement proteins on innate immune memory responses. (A) Schematic representation of the innate immune memory response assay. (B) Schematic simplified representation of the interaction of complement proteins with monocytes and macrophages. Factors in bold were tested for their ability to modulate innate immune memory responses. (C, D) PBMCs were stimulated for 24h with complement factors in low, medium, and high concentrations, after which the stimulus was washed away. After a 5-day resting period, cells were restimulated with LPS (10 ng/ml) for 24h and cytokine production was measured in the supernatant by ELISA (n = 6 donors). Data are expressed as log2 fold change compared to untrained (RPMI) PBMCs. p-values were calculated using an unpaired t-test. ns: not significant. Concentrations used for low, medium and high groups are: MBL 500 ng/ml, 10 and 20 µg/ml; C1q 50, 150 and 300 µg/ml; C4 1, 10, 50 µg/ml; C4a 0.5, 2, 5 µg/ml; C4b 0.5, 2, 5 µg/ml; C3 100 ng/ml, 1, 10 µg/ml; C3a 100, 500 ng/ml, 1 µg/ml; C3b 100, 500 ng/ml, 1 µg/ml; C5a 100, 250, 500 ng/ml.
Figure 2
Figure 2
C1q stimulation affects the transcriptome of monocytes. (A) Volcano plot representing RNA-seq data of monocytes stimulated with C1q (300 µg/ml) compared to control (RPMI). Significantly up-and downregulated genes are reported as red dots. Non-DEGs are presented as black dots. The cutoff for significance was p-adjusted< 0.1, fold change > 2, (n = 3 donors). (B) Significantly altered gene sets of the HALLMARK database in monocytes stimulated with C1q (300 µg/ml) versus control (RPMI). FDR< 0.1. (C–F) Gene set enrichment analysis of C1q (300 µg/ml) versus control (RPMI) dataset for the HALLMARK gene sets “Glycolysis” (C), “Oxidative phosphorylation” (D), “mTORC1 signaling” (E), and “Myc Targets V1” (F). NES, normalized enrichment score; FDR, false discovery rate.
Figure 3
Figure 3
C1q durably alters the metabolism of human primary monocytes. (A–D) PBMCs were stimulated for 24h with C1q (300 µg/ml), or with HKCA or RPMI as positive and negative controls, respectively. After a 5-day resting period, the cells’ metabolic activity was assessed by Seahorse analysis (n = 6 donors). Metabolic parameters (C, D) were calculated from the oxygen consumption rate (OCR) (A), or the extracellular acidification rate (ECAR) (B, A) OCR upon injection of oligomycin, carbonyl cyanide-4-(trifluoromethoxy) phenylhydrazone) (FCCP) and antimycin A + rotenone at indicated time points, in PBMCs stimulated with C1q (300 µg/ml), HKCA, or RPMI measured 6 days after treatment using Seahorse technology (n = 6 donors). Mean ± SEM. (B) Extracellular acidification rate (ECAR) upon injection of glucose, oligomycin, and 2-deoxyglucose (2-DG) at indicated time points, in PBMCs stimulated with C1q (300 µg/ml), HKCA, or RPMI measured 6 days after treatment using Seahorse technology (n = 6 donors). Mean ± SEM. (C) Spider plot of oxidative phosphorylation and glycolysis parameters as analyzed with Seahorse technology 6 days after stimulation in PBMCs stimulated with C1q (300 µg/ml), HKCA, or RPMI measured 6 days after treatment using Seahorse technology (n = 6 donors). (D) Glycolysis rate, and glycolytic capacity analyzed with Seahorse technology in PBMCs stimulated with C1q (300 µg/ml), HKCA, or RPMI measured 6 days after treatment using Seahorse technology (n = 6 donors). Data are represented as mean ± SEM (A, B, D) and mean fold change compared to RPMI control (RPMI) (C). Two-way repeated measures ANOVA for (A) F (24,120) = 5.712, p = 4.2 × 10⁻¹¹ and (B) F (24,120) = 4.352, p = 3.44 × 10⁻⁸; Bonferroni adjusted p-values of paired t-test between condition are indicated as *p< 0.05, ***p< 0.001. p-values in (D) were calculated using a one-tailed paired t-test.
Figure 4
Figure 4
Epigenetic profile of C1q-tolerized monocytes. (A) Volcano plot of genomic regions with altered abundance of H3K4me3 marks (fold change > 2 or< 0.5, p-value< 0.01) in monocytes stimulated for 24h with C1q (300 µg/ml) versus unstimulated monocytes (RPMI), 6 days after stimulation (n = 4 donors). (B) Top 15 Gene Ontology (GO) Biological Processes associated with genomic regions showing an altered abundance of H3K4me3 marks in monocytes stimulated for 24h with C1q (300 µg/ml) versus unstimulated monocytes (RPMI), as determined by ChIP-seq 6 days after stimulation (n = 4 donors). (C) Genomic annotations of H3K4me3 peaks (p< 0.01) (D) Transcription factors related to innate immune tolerance showing an altered abundance of H3K4me3 marks in monocytes stimulated for 24h with C1q (300 µg/ml) versus unstimulated monocytes (RPMI), as determined by ChIP-seq 6 days after stimulation (n = 4 donors). (E) H3K4me3 signal at TP53 as visualized in the Integrative Genomics Viewer. RPMI samples (n = 4 donors) compared to C1q (300 µg/ml) samples (n = 4 donors).
Figure 5
Figure 5
Single nucleotide polymorphisms in the proximity of genes encoding C1q components associate with innate immune memory responses. (A) Schematic representation of the in-vitro training experiments followed by QTL analysis using single nucleotide polymorphism (SNP) genotypes of volunteers of the 300BCG cohort. (B) Heatmap of SNPs that show a significant association with the capacity of β-glucan/BCG-induced trained immunity (n = 267 donors). Beta shows the direction of the effect (positive = SNP increases the fold change of cytokine production upon training, and negative = SNP decreases the fold change of cytokine production). (C) Associations of SNPs rs294179, rs1561624 near C1q with the cytokine responses after 24h restimulation with LPS (10 ng/ml), 5 days after β-glucan training (n = 267 donors). Boxplots show the genotype stratified fold changes in IL-6 and TNF responses for SNPs rs294179 and rs1561624. (D) Associations of SNPs rs666656, and rs913243 near C1q with the cytokine responses after 24h restimulation with LPS (10 ng/ml), 5 days after BCG training (n = 267 donors). Boxplots show the genotype stratified fold changes in IL-6 and TNF responses for SNPs rs666656 and rs913243. (E) Schematic representation of the in-vivo training experiments followed by QTL analysis using SNP genotypes of volunteers of the 300BCG cohort. (F) Heatmap of SNPs that show a significant association with the capacity of the BCG vaccine-induced trained immunity (n = 278 donors). Beta shows the direction of the effect (positive = SNP increases the fold change of cytokine production upon training, negative = SNP decreases the fold change of cytokine production) (G) Associations of SNPs rs10917276 and rs79073090 near C1q with the cytokine responses after vaccination with Bacillus Calmette–Guérin (BCG) vaccine (n = 278 donors). Boxplots show the genotype stratified fold changes in IL-1β and TNF responses for SNPs rs10917276 and rs79073090, respectively.

Similar articles

References

    1. Dunkelberger JR, Song W-C. Complement and its role in innate and adaptive immune responses. Cell Res. (2010) 20:34–50. doi: 10.1038/cr.2009.139 - DOI - PubMed
    1. Sim R, Dodds A. Complement. A practical approach. Dodds AW, Sim RB, editors. Oxford: IRL; (1997) p. 1–18.
    1. Rus H, Cudrici C, Niculescu F. The role of the complement system in innate immunity. Immunologic Res. (2005) 33:103–12. doi: 10.1385/IR:33:2:103 - DOI - PubMed
    1. Merle NS, Church SE, Fremeaux-Bacchi V, Roumenina LT. Complement system part I–molecular mechanisms of activation and regulation. Front Immunol. (2015) 6:262. doi: 10.3389/fimmu.2015.00262 - DOI - PMC - PubMed
    1. Thielens NM, Tedesco F, Bohlson SS, Gaboriaud C, Tenner AJ. C1q: A fresh look upon an old molecule. Mol Immunol. (2017) 89:73–83. doi: 10.1016/j.molimm.2017.05.025 - DOI - PMC - PubMed

LinkOut - more resources