. 2025 May 22:4:1504323.
doi: 10.3389/frcha.2025.1504323. eCollection 2025.

Unlocking the potential of wearable technology: Fitbit-derived measures for predicting ADHD in adolescents

Affiliations

Unlocking the potential of wearable technology: Fitbit-derived measures for predicting ADHD in adolescents

Muhammad Mahbubur Rahman. Front Child Adolesc Psychiatry. .

Abstract

Background: Attention-deficit/hyperactivity disorder (ADHD) is a common neurodevelopmental disorder with a complex etiology. The current diagnostic process for ADHD is often time-intensive and subjective. Recent advancements in machine learning offer new opportunities to improve ADHD diagnosis using diverse data sources. This study explores the potential of Fitbit-derived physical activity data to enhance ADHD diagnosis.

Method: We analyzed a sample of 450 participants from the Adolescent Brain Cognitive Development (ABCD) study (data release 5.0). Correlation analyses were conducted to examine associations between ADHD diagnosis and Fitbit-derived measurements, including sedentary time, resting heart rate, and energy expenditure. We then used multivariable logistic regression models to evaluate the predictive power of these measurements for ADHD diagnosis. Additionally, machine learning classifiers were trained to automatically classify individuals into ADHD+ and ADHD- groups.

Results: Our correlation analyses revealed statistically significant associations between ADHD diagnosis and Fitbit-derived physical activity data. The multivariable logistic regression models identified specific Fitbit measurements that significantly predicted ADHD diagnosis. Among the machine learning classifiers, the Random Forest outperformed others with cross-validation accuracy of 0.89, AUC of 0.95, precision of 0.88, recall of 0.90, F1-score of 0.89, and test accuracy of 0.88.

Conclusion: Fitbit-derived measurements show promise for predicting ADHD diagnosis, with machine learning classifiers, particularly Random Forest, demonstrating high predictive accuracy. These findings suggest that wearable data may contribute to more objective and efficient methods for ADHD identification, potentially enhancing clinical practices for diagnosis and management.

Keywords: ADHD; adolescent mental health; fitbit-derived physical activity; machine learning; wearable technology.


Conflict of interest statement

The author declares that the research was conducted in the absence of any commercial or financial relationships that could be construed as a potential conflict of interest.

Figures

Figure 1
Figure 1
Overview of the study design and methodology, including cohort identification, data integration, analysis procedures, and model selection. The figure illustrates the key stages of the research: (1) identification of ADHD+ and ADHD− groups from the ABCD dataset based on diagnostic criteria and inclusion/exclusion rules; (2) integration of Fitbit data for daily and weekly activity summaries; (3) statistical analysis to explore relationships between ADHD status and Fitbit measurements; (4) predictive modeling using various machine learning algorithms to predict ADHD diagnosis.
Figure 2
Figure 2
Variability in weekly Fitbit measurements between ADHD+ and ADHD− groups. Box plots showing weekly average sedentary time (in minutes), resting heart rate (in beats per minute), and energy expenditure (in METS/min) for each group. The x-axis indicates the ADHD diagnosis groups (ADHD+ vs. ADHD−) and the y-axis represents the measurement values. The blue box is ADHD+ group, and the orange box is ADHD− group.
Figure 3
Figure 3
Area under the curve (AUC) scores of machine learning classifiers for distinguishing ADHD+ and ADHD− groups. This bar chart displays the AUC scores for various machine learning classifiers, highlighting their performance in distinguishing between ADHD+ and ADHD− groups. The x-axis represents the classifiers, and the y-axis shows the corresponding AUC scores.
Figure 4
Figure 4
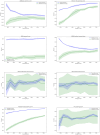
Learning curves of different machine learning classifiers using 10-fold CV with training data: training and validation accuracy across varying sample sizes. These graphs show the performance for various classifiers, with the x-axis representing the accuracy and the y-axis representing the training set size. The blue line indicates the training accuracy, while the green line represents the validation accuracy, illustrating how the model performance evolves with increasing sample sizes.
Figure 5
Figure 5
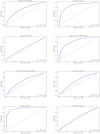
ROC curves for different classifiers: true positive rate (TPR) vs. false positive rate (FPR). These graphs display the ROC curves for various classifiers, where the x-axis represents the FPR, and the y-axis represents the TPR. The blue lines show corresponding AUC scores at different FPR and TPR values. The dotted straight line represents the diagonal line connecting the lowest (0,0) and highest (1,1) FPR and TPR ratios, which serves as a reference.
Figure 6
Figure 6
10-fold cross-validation (CV) scores for different classifiers. This graph shows the accuracy scores of various machine learning classifiers during 10-fold CV for predicting ADHD+ and ADHD− groups. The x-axis represents the 10 folds of the cross-validation (from 1 to 10), while the y-axis shows the accuracy achieved by each classifier across these folds. Different colors correspond to different classifiers, as indicated in the legend. The plot highlights the performance stability and variability of each classifier across the folds.

Similar articles

References

    1. Bitsko RH, Claussen AH, Lichstein J, Black LI, Jones SE, Danielson ML, et al. Mental health surveillance among children—United States, 2013–2019. MMWR Suppl. (2022) 71(2):1–42. 10.15585/mmwr.su7102a1 - DOI - PMC - PubMed
    1. Kessler RC, Adler L, Barkley R, Biederman J, Conners CK, Demler O, et al. The prevalence and correlates of adult ADHD in the United States: results from the national comorbidity survey replication. Am J Psychiatry. (2006) 163(4):716–23. 10.1176/ajp.2006.163.4.716 - DOI - PMC - PubMed
    1. Varrasi S, Boccaccio FM, Guerrera CS, Platania GA, Pirrone C, Castellano S. Schooling and occupational outcomes in adults with ADHD: predictors of success and support strategies for effective learning. Educ Sci (Basel). (2022) 13(1):37. 10.3390/educsci13010037 - DOI
    1. Faraone SV, Bellgrove MA, Brikell I, Cortese S, Hartman CA, Hollis C, et al. Attention-deficit/hyperactivity disorder. Nat Rev: Dis Primers. (2024) 10(1):11. 10.1038/s41572-024-00495-0 - DOI - PubMed
    1. Danielson ML, Bitsko RH, Ghandour RM, Holbrook JR, Kogan MD, Blumberg SJ. Prevalence of parent-reported ADHD diagnosis and associated treatment among U.S. children and adolescents, 2016. J Clin Child Adolesc Psychol. (2018) 47(2):199–212. 10.1080/15374416.2017.1417860 - DOI - PMC - PubMed

LinkOut - more resources