

Dietary energy and protein gradients drive metabolic adaptation in growing-finishing yaks on the Qinghai-Tibet plateau
- PMID: 40487107
- PMCID: PMC12143763
- DOI: 10.1016/j.aninu.2025.01.009
Dietary energy and protein gradients drive metabolic adaptation in growing-finishing yaks on the Qinghai-Tibet plateau
Abstract
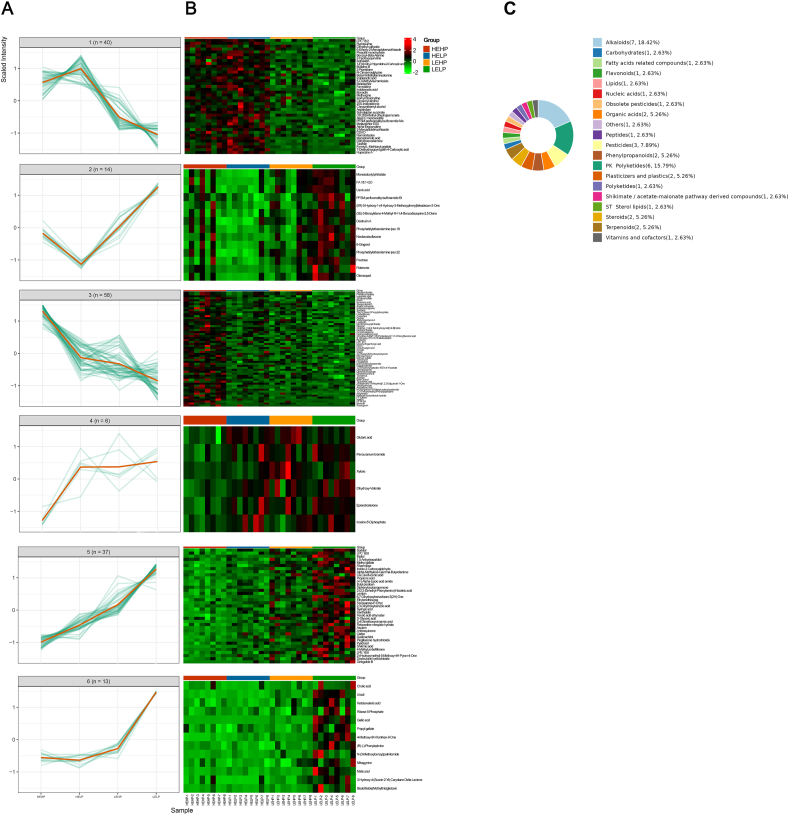
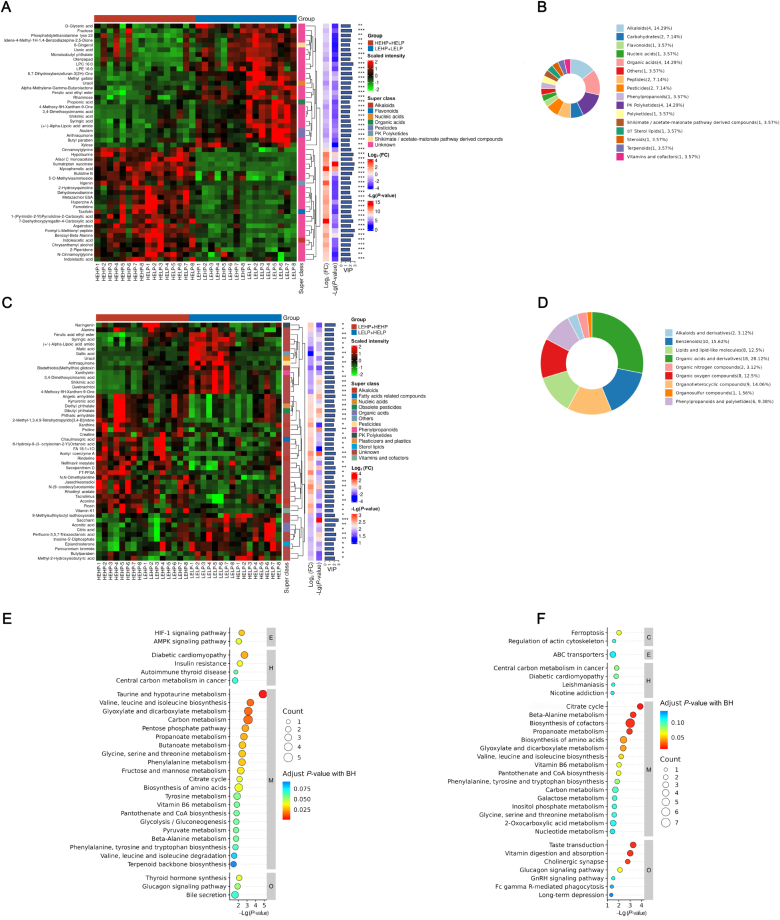
The study investigated the metabolic responses of yaks to dietary net energy for gain (NEg) and metabolizable protein (MP), and explored potential biomarkers for average daily gain (ADG) in serum metabolites. A total of 40 three-year-old yaks (initial body weight = 255 ± 8.04 kg) were assigned to a 2 × 2 factorial treatment arrangement based on dietary NEg (4.18 vs 4.81 MJ/kg DM; low NEg [LE] vs high NEg [HE]) and MP (72.0 vs 82.8 g/kg DM; low MP [LP] vs high MP [HP]), comprising 4 treatments with 10 replicates each (1 yak per replicate). The yaks were fed these diets for 55 days including a 15-day adaptation period. Yaks on HP diets had greater ADG (P = 0.013) and a reduced feed-to-gain ratio (P = 0.019) compared to those on the LP diet, and those on the LE diet had greater dry matter intake (P < 0.001) but unaffected ADG compared to those on the HE diet (P > 0.05). Dietary NEg interacted with MP in relation to the apparent digestibility of dry matter (P = 0.028) and crude protein (P < 0.001). The apparent digestibility of gross energy (GE), organic matter, and neutral detergent fiber in yaks on the HE diet was greater than those in yaks on the LE diet (P < 0.05). The digestibility of GE in yaks on the HP diet was lower than those on the LP diet (P = 0.011). An significant interaction between dietary NEg level and MP level was observed on serum total bilirubin concentration, catalase concentration, and superoxide dismutase concentration (P < 0.05). Yaks fed HE diets exhibited higher serum glutathione peroxidase protein concentration (P < 0.001), but lower serum triglyceride concentration (P = 0.012) compared to those fed LE diets. Serum level of alanine transaminase was higher in yaks on the HP diet compared to those on the LP diet (P = 0.038). Untargeted metabolomics identified novel biomarkers linked to dietary NEg and MP levels, revealing that the HE diet enhanced adenosine triphosphate production through acetyl-CoA synthesis and affected amino acid, fat, and carbohydrate pathways (P < 0.05). The HP diet altered the synthesis of aromatic amino acids and vitamins (P < 0.05). Additionally, random forest analysis identified N-(9-oxodecyl) acetamide and biliverdin, as biomarkers for predicting ADG. These findings provide a theoretical foundation for the effective feeding and nutritional management of yaks.
Keywords: Metabolizable protein; Net energy for gain; Serum metabolite; Yak.
© 2025 The Authors.
Conflict of interest statement
We declare that we have no financial and personal relationships with other people or organizations that can inappropriately influence our work, and there is no professional or other personal interest of any nature or kind in any product, service and/or company that could be construed as influencing the content of this paper.
Figures


Similar articles
-
A comparison of average daily gain, apparent digestibilities, energy balance, rumen fermentation parameters, and serum metabolites between yaks (Bos grunniens) and Qaidam cattle (Bos taurus) consuming diets differing in energy level.Anim Nutr. 2022 Sep 5;12:77-86. doi: 10.1016/j.aninu.2022.07.015. eCollection 2023 Mar. Anim Nutr. 2022. PMID: 36514373 Free PMC article.
-
Interactions of energy and predicted metabolizable protein in determining nitrogen efficiency in the lactating dairy cow.J Dairy Sci. 2010 May;93(5):2034-43. doi: 10.3168/jds.2008-1777. J Dairy Sci. 2010. PMID: 20412918
-
The effects of dietary energy level on the growth performance of yaks (Bos grunniens) were studied based on omics technique.Front Microbiol. 2025 Aug 12;16:1621581. doi: 10.3389/fmicb.2025.1621581. eCollection 2025. Front Microbiol. 2025. PMID: 40873704 Free PMC article.
-
Nutrient digestibility and feedlot performance of lambs fed diets varying protein and energy contents.Trop Anim Health Prod. 2010 Jun;42(5):941-6. doi: 10.1007/s11250-009-9511-8. Epub 2009 Dec 13. Trop Anim Health Prod. 2010. PMID: 20012892 Clinical Trial.
-
Effects of low-energy diet supplemented with betaine on growth performance, nutrient digestibility, and serum metabolomic profiles in growing pigs.J Anim Sci. 2023 Jan 3;101:skad080. doi: 10.1093/jas/skad080. J Anim Sci. 2023. PMID: 36930062 Free PMC article.
Cited by
-
Bioinformatics Analysis of Candidate Genes Related to Fat Deposition in Yaks at Different Energy Levels.Curr Issues Mol Biol. 2025 May 22;47(6):385. doi: 10.3390/cimb47060385. Curr Issues Mol Biol. 2025. PMID: 40699784 Free PMC article.
-
Effects of Rumen-Protected Taurine Supplementation on Ruminal Fermentation, Hematological Profiles, Liver Function, and Immune Responses in Yaks.Animals (Basel). 2025 Jun 30;15(13):1929. doi: 10.3390/ani15131929. Animals (Basel). 2025. PMID: 40646828 Free PMC article.
References
-
- Agle M., Hristov A.N., Zaman S., Schneider C., Ndegwa P., Vaddella V.K. The effects of ruminally degraded protein on rumen fermentation and ammonia losses from manure in dairy cows. J Dairy Sci. 2010;93(4):1625–1637. - PubMed
-
- AOAC. Official methods of analysis of AOAC International. 22nd ed. Arlington, Virginia, USA: Association of Official Analytical Chemists; 2023.
-
- AOAC . 17th ed. AOAC International; Gaithersburg, MD: 2005. Afficial methods of analysis.
-
- Arora V.M.A.D. IntechOpen; Rijeka: 2023. Role of acetylcholine in chronic diseases.
LinkOut - more resources
Full Text Sources
Research Materials
Miscellaneous
