. 2025 May 9:32:101851.
doi: 10.1016/j.mtbio.2025.101851. eCollection 2025 Jun.

Integrating gene demethylation and immune modulation: PD-1 nanovesicles as a dual-action therapy for NSCLC

Affiliations

Integrating gene demethylation and immune modulation: PD-1 nanovesicles as a dual-action therapy for NSCLC

Heng Zhang et al. Mater Today Bio. .

Abstract

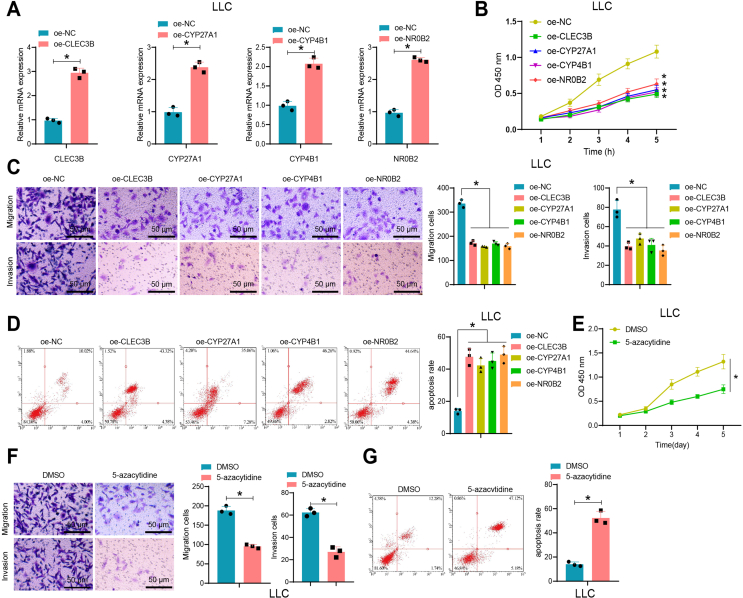
Non-small cell lung cancer (NSCLC) remains a formidable challenge in oncology, underscoring the urgent need for innovative therapeutic strategies. This study explores the potential of PD-1-modified multifunctional nanovesicles (NVs) loaded with 5-azacytidine (5-Aza) for NSCLC treatment. By integrating bioinformatics analyses with in vitro and in vivo experiments, methylation-driven genes closely associated with NSCLC progression and prognosis-CLEC3B, CYP27A1, CYP4B1, and NR0B2-were identified. Functional assays revealed that 5-Aza effectively demethylates these genes, reducing NSCLC cell proliferation, migration, and invasion. PD-1-modified NVs demonstrated precise targeting of NSCLC cells via PD-L1 binding, while the combination of PD-1 NVs and 5-Aza synergistically enhanced peripheral blood mononuclear cell activation, induced apoptosis, and amplified anti-tumor immunity. In vivo, studies confirmed the tumor-targeting ability and significant therapeutic efficacy of PD-1 NVs. This synergistic strategy of epigenetic modulation and immune activation offers a promising avenue for NSCLC management. These findings contribute valuable insights into developing targeted nanotherapeutics for effective NSCLC treatment.

Keywords: 5-Azacytidine; Epigenetic therapy; Immune activation; Non-small cell lung cancer (NSCLC); PD-1-Modified nanovesicles.


Conflict of interest statement

The authors declare that they have no known competing financial interests or personal relationships that could have appeared to influence the work reported in this paper.

Figures

Image 1
Graphical abstract
Fig. 1
Fig. 1
Methylation-driven genes associated with adverse prognosis in NSCLC tumors. Note: (A) Volcano plot displaying the differential methylation levels of promoter CpG sites in the TCGA dataset related to NSCLC. Red dots represent upregulated methylation sites, while blue dots represent downregulated ones; (B) Volcano plot displaying the differential gene expression in the TCGA dataset related to NSCLC. Red dots represent upregulated genes, while blue dots represent downregulated ones; (C) Venn diagram showing the intersection genes between 382 low-risk genes (gene1) and the 312 genes (gene2) corresponding to highly methylated sites; (D) Kaplan-Meier analysis illustrating the relationship between gene expression levels and prognosis in NSCLC patients. The X-axis represents survival time, the Y-axis represents the survival rate, the red line represents the high-expression group, and the blue line represents the low-expression group; (E) Spearman analysis displaying the correlation between gene expression and promoter methylation levels; (F) Heatmap showing the clinical relevance of high and low gene expression in NSCLC tumor tissues. There are 257 cases in the high-expression group and 256 cases in the low-expression group. Below are color blocks representing the corresponding clinical characteristics, where ∗ p < 0.05, p < 0.01, and ∗∗p < 0.001 denote statistical significance. (For interpretation of the references to color in this figure legend, the reader is referred to the Web version of this article.)
Fig. 2
Fig. 2
Construction of NSCLC prognostic risk model. Note: (A) Forest plot of multivariate Cox analysis, where Hazard ratio indicates the risk rate, values greater than 1 define high-risk factors, while values less than 1 define low-risk factors; (B) Based on the results of multivariate Cox analysis, NSCLC patients in the TCGA dataset were classified into high-risk and low-risk groups. The green color represents the low-risk group, while the red color represents the high-risk group. The X-axis represents the distribution of patients from low to high-risk values, and the Y-axis represents the risk values; (C) Survival status of NSCLC patients in the high-risk and low-risk groups. The X-axis represents the distribution of patients from low to high-risk values, and the Y-axis represents the patient's survival time. The green dots represent the surviving patients, while the red dots represent the deceased patients; (D) Survival curves of NSCLC patients in the high-risk and low-risk groups. The X-axis represents the survival time, and the Y-axis represents the survival rate. The red line represents the high-risk group (256 cases), while the blue line represents the low-risk group (257 cases); (E) Independent prognostic ability of the multivariate Cox analysis-based prognostic risk model, where the left side represents various clinical features and the prognostic model risk values. The middle section represents the p-values, where p < 0.05 indicates that the factor can be used as an independent prognostic factor. Hazard ratio indicates the risk rate; (F) Based on the results of multivariate Cox analysis, NSCLC patients in the GEO dataset were classified into high-risk and low-risk groups. The green color represents the low-risk group, while the red color represents the high-risk group. The X-axis represents the distribution of patients from low to high risk values, and the Y-axis represents the risk values; (G) Survival status of NSCLC patients in the high-risk and low-risk groups. The X-axis represents the distribution of patients from low to high-risk values, and the Y-axis represents the patient's survival time. The green dots represent the surviving patients, while the red dots represent the deceased patients; (H) Survival curves of NSCLC patients in the high-risk and low-risk groups. The X-axis represents the survival time, and the Y-axis represents the survival rate. The red line represents the high-risk group (24 cases), while the blue line represents the low-risk group (24 cases). (For interpretation of the references to color in this figure legend, the reader is referred to the Web version of this article.)
Fig. 3
Fig. 3
Methylation levels of CLEC3B, CYP27A1, CYP4B1, and NR0B2 promoters in NSCLC cells. Note: (A) Expression levels of CLEC3B, CYP27A1, CYP4B1, and NR0B2 in NSCLC cells of HCC78 and LLC (mouse) detected by RT-qPCR; (B) Methylation levels of CLEC3B, CYP27A1, CYP4B1, and NR0B2 promoters in NSCLC cells of HCC78 and LLC (mouse) detected by MSP experiment; (C) Expression levels of CLEC3B, CYP27A1, CYP4B1, and NR0B2 in NSCLC cells detected by RT-qPCR after treatment with 5-azacytidine; (D) Methylation levels of CLEC3B, CYP27A1, CYP4B1, and NR0B2 promoters in NSCLC cells detected by MSP experiment after treatment with 5-azacytidine; (E) Expression levels of CLEC3B, CYP27A1, CYP4B1, and NR0B2 in HCC78 cells detected by RT-qPCR; after overexpressing CLEC3B, CYP27A1, CYP4B1, and NR0B2, respectively, (F) Proliferation capacity of HCC78 cells evaluated using the CCK-8 assay; (G) Migration and invasion capacity of HCC78 cells assessed using the Transwell assay, scale bar = 50 μm; (H) Assessment of apoptosis in HCC78 cells using flow cytometry; after treatment with 5-azacytidine, (I) Proliferation capacity of HCC78 cells evaluated using the CCK-8 assay; (J) Migration and invasion capacity of HCC78 cells assessed using the Transwell assay, scale bar = 200 μm; (K) Assessment of apoptosis in HCC78 cells using flow cytometry; (L) 5-azacytidine reduces the DNA methylation levels of CLEC3B, CYP27A1, CYP4B1, and NR0B2, thereby influencing the biological functions of NSCLC cells. This process involves the demethylation of DNA, which activates the expression of these target genes, consequently regulating the proliferation, migration, and apoptosis of NSCLC cells. The red arrow indicates inhibitory effects, and the green arrow indicates activation. The diagram illustrates the effect of 5-azacytidine on the promoter region of target genes and its impact on cellular behavior. ∗ indicates statistically significant differences between the two groups, p < 0.05; all cell experiments were repeated 3 times. (For interpretation of the references to color in this figure legend, the reader is referred to the Web version of this article.)
Fig. 4
Fig. 4
Preparation and characterization of human PD-1_NVs. Note: (A) Schematic of the construction process for PD-1_NVs. First, a plasmid containing the PD-1 gene is transfected into HEK293T cells. After culture and expansion, PD-1 protein is successfully expressed. The cell membrane from HEK293T cells is then extracted and used to form PD-1 nanovesicles (PD-1 NVs), which can be utilized for targeting NSCLC cells and enhancing anti-tumor immune responses; (B) Confocal images showing the membrane localization of PD-1-GFP in HEK293T cell line, WGA 594 dye used for labeling the cell membrane, scale bar = 25 μm; (C) Western blot detection of PD-1 expression in whole-cell lysates of overexpressed PD-1-GFP in HEK293T; (D) TEM images displaying the shape and size of NVs, scale bar = 100 nm; (E) DLS measurement of the size distribution of NVs; (F) DLS measurement of the zeta potential of NVs; (G) Western blot detection of PD-1 expression in cell NVs.∗ indicates statistically significant differences between the two groups, p < 0.05, all cell experiments were repeated 3 times.
Fig. 5
Fig. 5
Validation of the targeting ability of PD-1_NVs on NSCLC cells (HCC78). Note: (A) FACS analysis of PD-L1 expression in HCC78 cells; (B) RT-qPCR analysis of PD-L1 expression in HCC78 cells; (C) Confocal microscopy analysis of the co-localization of PD-1 NVs and HCC78 cell membrane, scale bar = 25 μm; (D) Schematic representation of PD-L1 blockade on NSCLC cells using an anti-PD-L1 antibody, PD-1_NVs interact with anti-PD-L1 antibody (aPD-L1) to block the binding of PD-L1 on the surface of NSCLC cells, further validating the molecular interaction between PD-1 and PD-L1. This experiment demonstrates that PD-1_NVs target the surface of NSCLC cells by competitively blocking the PD-L1/PD-1 immune inhibitory pathway; (E) Confocal microscopy analysis of the co-localization of PD-1 NVs and HCC78 cell membrane after aPD-L1 treatment, scale bar = 25 μm; (F) Flow cytometry analysis of the binding of PD-1 NVs to HCC78 cells after aPD-L1 treatment; (G) Co-IP and western blot analysis of the interaction between PD-1_NVs and PD-L1 in HCC78 cells, immunoprecipitation; immunoblotting; whole cell lysates. ∗ indicates a statistically significant difference between the two groups (p < 0.05); all cell experiments were repeated 3 times.
Fig. 6
Fig. 6
Effect of PD-1&5-Aza_NVs on PBMC activation and NSCLC cell apoptosis. Note: (A) Biocompatibility evaluation of PD-1 nanoparticles in normal lung cells; (B) Schematic representation of PD-1 nanoparticles carrying 5-azacytidine to prepare PD-1&5-Aza nanoparticles. 5-azacytidine is loaded into PD-1 nanovesicles to form PD-1&5-Aza_NVs. These nanovesicles can simultaneously target NSCLC cells and release 5-azacytidine, thereby achieving synergistic anti-tumor therapy; (C) Encapsulation efficiency of 5-azacytidine in PD-1 nanoparticles; (D) In vitro drug release test of 5-azacytidine from PD-1 nanoparticles; (E) Effect of PD-1&5-Aza nanoparticles on apoptosis in NSCLC cells; (F) Schematic representation of co-culture of PBMCs with NSCLC cells; (G) Flow cytometry analysis of the proliferation of PBMCs in the co-culture system; (H) Flow cytometry analysis of apoptosis in NSCLC cells in the co-culture system. ∗ indicates a statistically significant difference between the two groups (p < 0.05); all cell experiments were repeated 3 times.
Fig. 7
Fig. 7
In vivo targeting validation of mPD-1_NV on NSCLC tumors. Note: (A) Schematic representation of the construction and experimental procedure of the lung adenocarcinoma mouse model. Cy5-labeled NC_NVs and mPD-1_NVs are intravenously injected into the mouse. Fluorescence imaging is performed at different time points (0 h, 1 h, 4 h, 12 h) to assess the accumulation of nanovesicles in the tumor area. The fluorescence intensity in the tumor region is measured to evaluate the targeting ability of the mPD-1_NVs. This experiment demonstrates the tumor-targeting capability of mPD-1_NVs and provides data for further studies on their application in NSCLC therapy; (B) H&E staining assessment of the tissue toxicity of NC NVs and mPD-1 NVs, scale bar = 100 μm; (C) Fluorescently labeled NC NVs and mPD-1 NVs were intravenously injected in lung adenocarcinoma mice to observe the enrichment of fluorescent signal in tumors; (D) In vivo imaging of the biodistribution of NC NVs and mPD-1 NVs in mice; (E) Fluorescent imaging of NC NVs and mPD-1 NVs at different time points in mice, white circles represent tumor lesions. ∗ indicates a statistically significant difference between the two groups (p < 0.05); each group consisted of 5 mice.
Fig. 8
Fig. 8
Antitumor therapeutic effects of mPD-1_NV in the body. Note: (A) Experimental flowchart of the antitumor therapeutic effects of mPD-1&5-Aza nanoparticles; (B) Average body weight variation curves of mice in each group; (C) Tumor growth curves of mice in each group; (D) Final size and weight of removed tumors in each group of mice; (E) Solid representation of the final size of removed tumors in each group of mice; (F) Immunohistochemical detection of positive Ki67 expression in tumor tissues; (G) Flow cytometry analysis of the number of CD8+ T cells in tumor tissues; (H) Immunohistochemical detection of the expression of CLEC3B, CYP27A1, CYP4B1, and NR0B2 in tumor tissues post mPD-1&5-Aza_NVs administration (Scale bar = 50 μm). ∗ indicates a significant difference between the two groups with p < 0.05, with 5 mice in each group.
figs1
figs1
figs2
figs2
figs3
figs3
figs4
figs4
figs5
figs5
figs6
figs6
figs7
figs7

Similar articles

References

    1. Chen Y., Chen Z., Chen R., Fang C., Zhang C., Ji M., Yang X. Immunotherapy-based combination strategies for treatment of EGFR-TKI-resistant non-small-cell lung cancer. Future Oncol. 2022;18:1757–1775. doi: 10.2217/fon-2021-0862. - DOI - PubMed
    1. Wang Z.-H., Ye L.-L., Xiang X., Wei X.-S., Niu Y.-R., Peng W.-B., Zhang S.-Y., Zhang P., Xue Q.-Q., Wang H.-L., Du Y.-H., Liu Y., Ai J.-Q., Zhou Q. Circular RNA circFBXO7 attenuates non-small cell lung cancer tumorigenesis by sponging miR-296-3p to facilitate KLF15-mediated transcriptional activation of CDKN1A. Transl. Oncol. 2023;30 doi: 10.1016/j.tranon.2023.101635. - DOI - PMC - PubMed
    1. Wang Q, Zeng A, Zhu M, Song L. Dual inhibition of EGFR‑VEGF: An effective approach to the treatment of advanced non‑small cell lung cancer with EGFR mutation (Review) Int J Oncol. 2023;62(2) doi: 10.3892/ijo.2023.5474. - DOI - PMC - PubMed
    1. Atchley W.T., Alvarez C., Saxena-Beem S., Schwartz T.A., Ishizawar R.C., Patel K.P., Rivera M.P. Immune checkpoint inhibitor-related Pneumonitis in lung cancer. Chest. 2021;160:731–742. doi: 10.1016/j.chest.2021.02.032. - DOI - PMC - PubMed
    1. Isomoto K., Haratani K., Tsujikawa T., Makutani Y., Kawakami H., Takeda M., Yonesaka K., Tanaka K., Iwasa T., Hayashi H., Ito A., Nishio K., Nakagawa K. Mechanisms of primary and acquired resistance to immune checkpoint inhibitors in advanced non–small cell lung cancer: a multiplex immunohistochemistry–based single-cell analysis. Lung Cancer. 2022;174:71–82. doi: 10.1016/j.lungcan.2022.10.012. - DOI - PubMed

LinkOut - more resources