

Automatic quantification of left atrium volume for cardiac rhythm analysis leveraging 3D residual UNet for time-varying segmentation of ECG-gated CT
- PMID: 40487246
- PMCID: PMC12143801
- DOI: 10.1016/j.csbj.2025.04.039
Automatic quantification of left atrium volume for cardiac rhythm analysis leveraging 3D residual UNet for time-varying segmentation of ECG-gated CT
Abstract
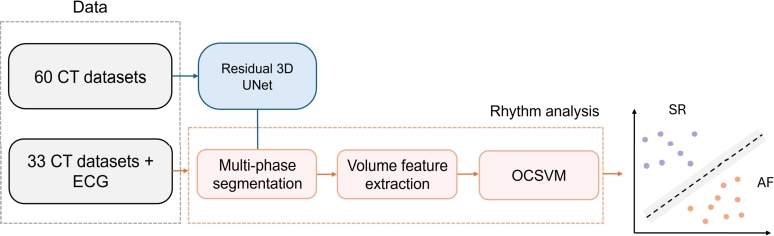
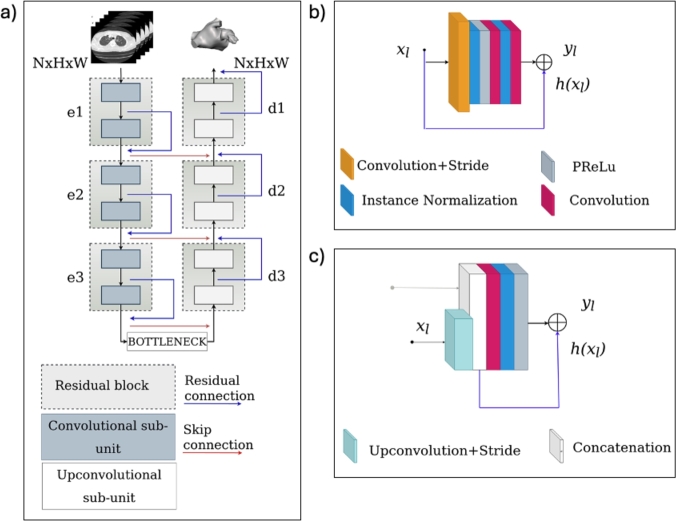
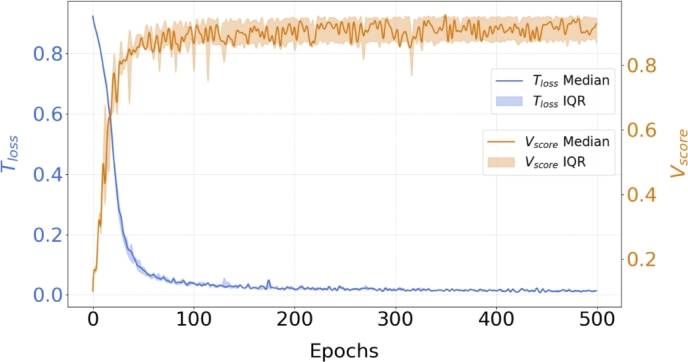
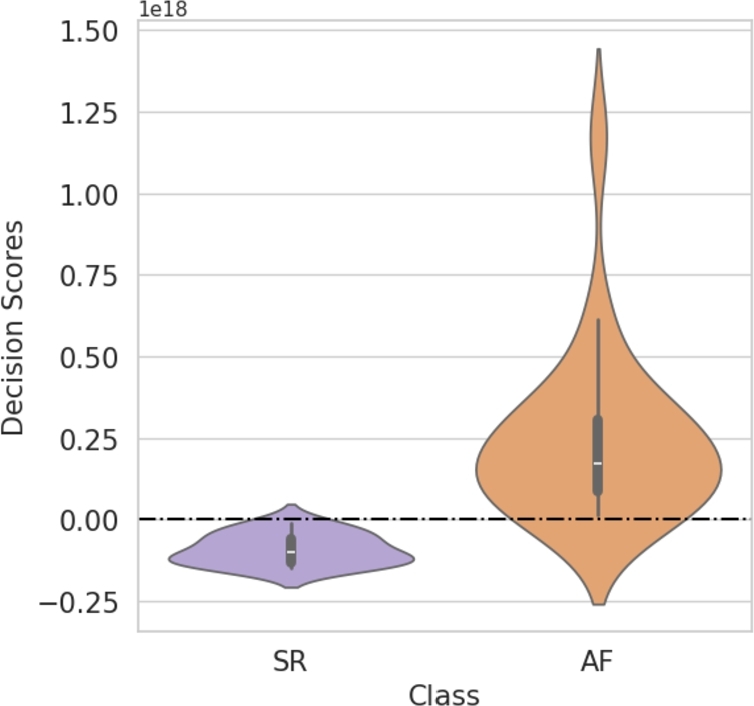
Atrial fibrillation (AF) is a heart condition widely recognized as a significant risk factor for stroke. Left atrial (LA) volume variation has been identified as a key predictor of AF, and several researchers have proposed deep learning models capable of quickly providing this measurement by processing computed tomography (CT) or magnetic resonance images. In clinical imaging, time-varying ECG-gated CT offers precise information about LA anatomy and function, which could help in developing personalized treatment plans for AF patients. Furthermore, advancements in time-varying dataset acquisition indicate the potential for expanding the role of CT in the management of AF patients through specialized processing techniques. However, automatic segmentation of the LA across all cardiac phases remains challenging due to significant variations in both anatomical structures and image signals throughout the cardiac cycle. To overcome these challenges, this study presents a comprehensive AI-based framework designed to segment the LA across the entire cardiac cycle and classify patients with AF. Specifically, our framework employs a customized Residual 3D-UNet model to segment the LA from time-varying ECG-gated CT scans and utilizes a One-Class Support Vector Machine (OCSVM) to distinguish patients in sinus rhythm (SR) from those with AF. A dataset of 93 time-varying ECG-gated CT scans was retrospectively collected: 60 patients were used for the segmentation task, while 33 patients were used for the classification task. The Residual 3D-UNet model demonstrated high accuracy, achieving a mean Dice score of 0.94, with consistent precision (94.45%) and recall (94.83%) across ten cardiac phases. The OCSVM achieved 78.7% accuracy with high specificity (86.3%), effectively minimizing the risk of misclassifying AF as SR, although sensitivity was lower at 70%, demonstrating the potential of automated segmentation and rhythm classification, providing a potential valuable tool for AF diagnosis.
Keywords: Atrial fibrillation; Left atrium; Segmentation; Time varying ECG-gated CT; Volume variation analysis.
© 2025 The Author(s).
Conflict of interest statement
The authors have declared no conflict of interest.
Figures


References
-
- Wolf P.A., Abbott R.D., Kannel W.B. Atrial fibrillation as an independent risk factor for stroke: the framingham study. Stroke. 1991;22(8):983–988. - PubMed
-
- Korsholm Kasper, Berti Sergio, Iriart Xavier, Saw Jacqueline, Wang Dee Dee, Cochet Hubert, et al. Expert recommendations on cardiac computed tomography for planning transcatheter left atrial appendage occlusion. Cardiovasc Interv. 2020;13(3):277–292. - PubMed
-
- Korsholm Kasper, Iriart Xavier, Saw Jacqueline, Wang Dee Dee, Berti Sergio, Galea Roberto, et al. Position statement on cardiac computed tomography following left atrial appendage occlusion. Cardiovasc Interv. 2024;17(15):1747–1764. - PubMed
LinkOut - more resources
Full Text Sources
Research Materials