

N4BP3 Activates TLR4-NF-κB Pathway in Inflammatory Bowel Disease by Promoting K48-Linked IκBα Ubiquitination
- PMID: 40487287
- PMCID: PMC12145111
- DOI: 10.2147/JIR.S518155
N4BP3 Activates TLR4-NF-κB Pathway in Inflammatory Bowel Disease by Promoting K48-Linked IκBα Ubiquitination
Abstract
Purpose: N4BP3 is a ubiquitination-related gene that plays a pivotal role in neurology and neoplasia. Studies have demonstrated its essential function in axonal and dendritic branching, promoting hepatocellular carcinoma and breast cancer. Our previous research reveals that N4BP3 enhances inflammatory responses by modulating the NOD2 signaling pathway. It is crucial to investigate whether N4BP3 regulates inflammatory bowel disease (IBD) through the TLR4 signaling pathway and to elucidate the underlying mechanisms.
Methods: Lipopolysaccharides (LPS) were used to activate the TLR4 pathway in THP-1/Caco-2 cells. THP-1/Caco-2 cells were transfected with either N4BP3 overexpression or knockdown plasmids, generating N4BP3-overexpressing or N4BP3-deficient cell lines. For in vivo studies, colitis was induced in mice using dextran sodium sulfate (DSS). Additionally, negative control and N4BP3-knockdown C57BL/6 mouse models were established via intraperitoneal injection of control or N4BP3-targeting adeno-associated virus (AAV).
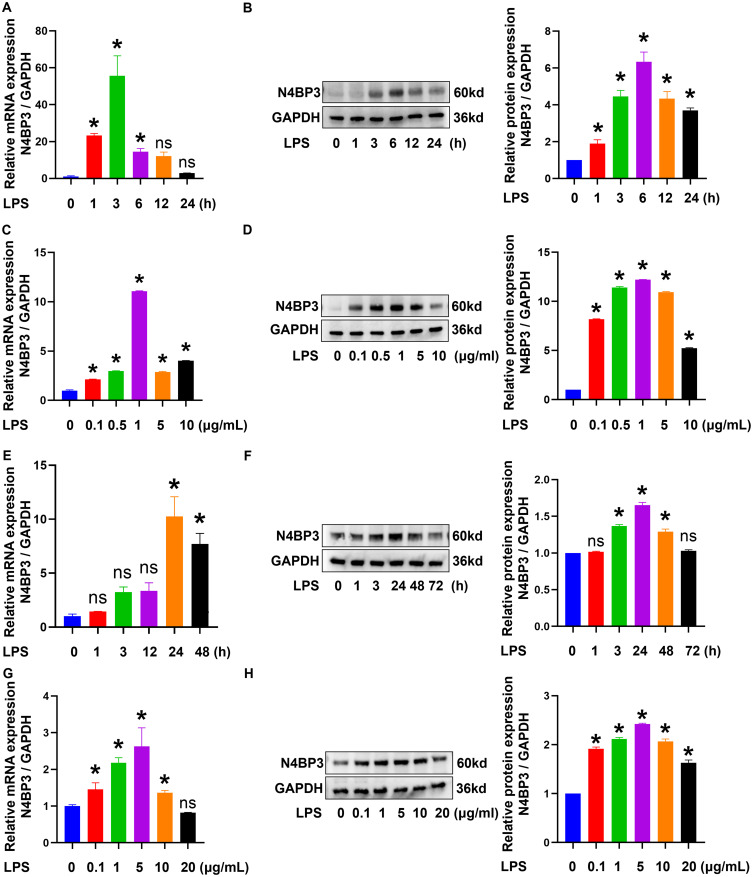
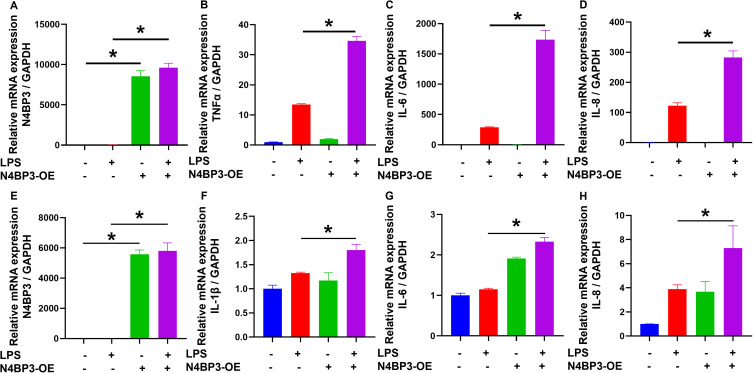
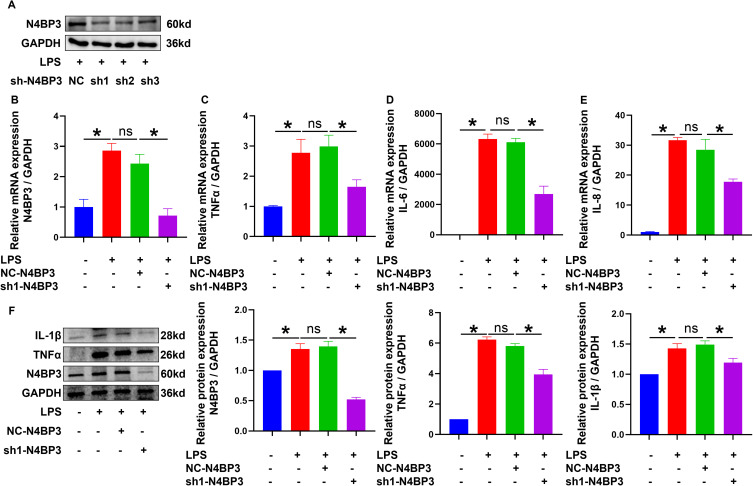
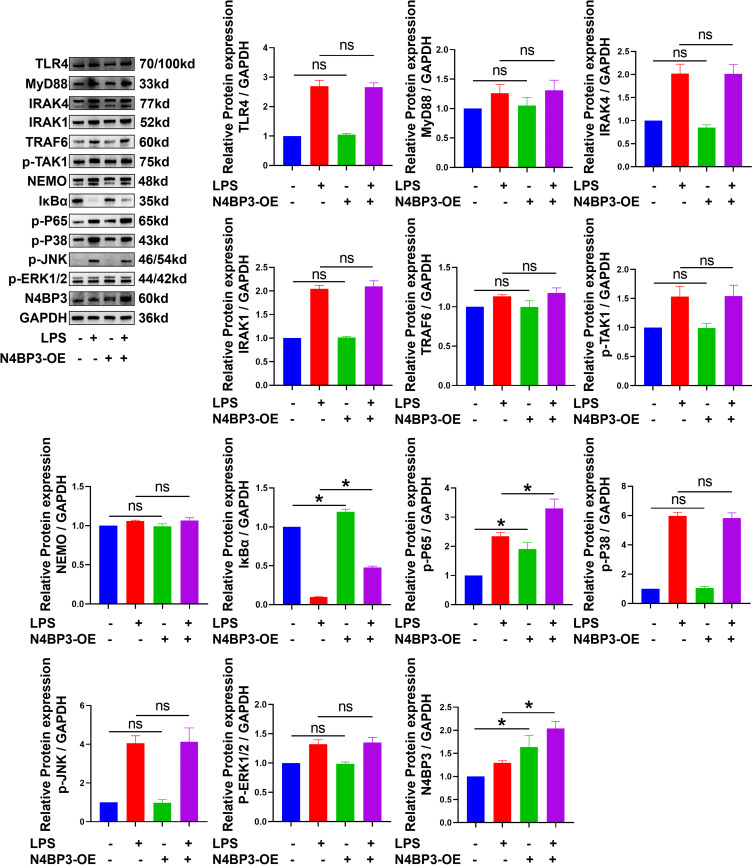
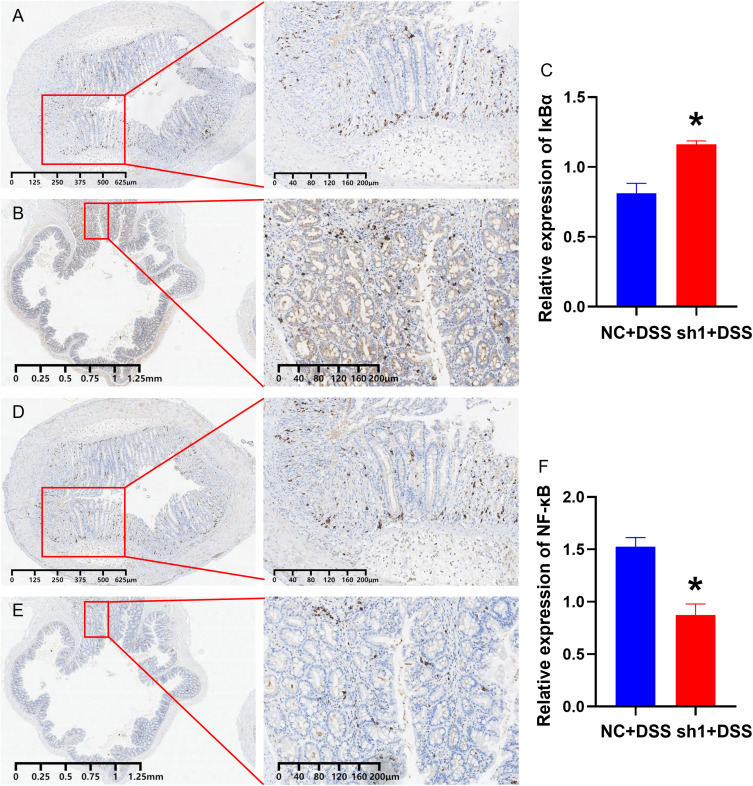
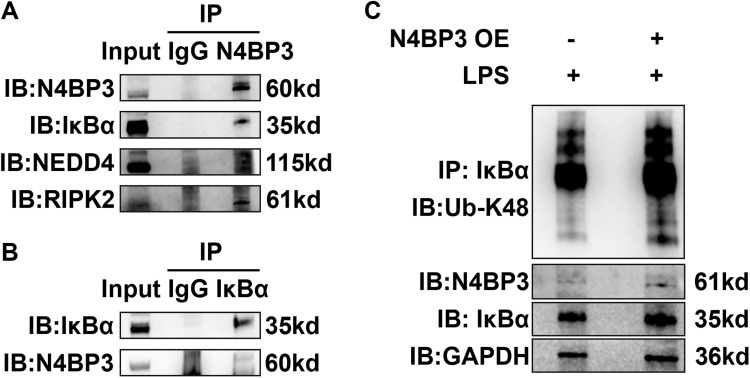
Results: LPS stimulation significantly upregulated N4BP3 expression in THP-1/Caco-2 cells compared to sterile water treatment (P < 0.05). In N4BP3-overexpressing cells, LPS induction led to significantly higher expression of TNF-α, IL-1β, IL-6, and IL-8 mRNA, as well as phospho-NF-κB p65 protein, compared to wild-type THP-1/Caco-2 cells (P < 0.05). Conversely, these inflammatory markers were markedly downregulated in N4BP3-knockdown THP-1 cells following LPS stimulation (P < 0.05). In DSS-induced colitis models, N4BP3-knockdown mice showed decreased phospho-NF-κB p65 but increased IκBα protein expression in colonic tissues compared to DSS-treated control mice (P < 0.05). Furthermore, we observed interaction between N4BP3 and IκBα, with N4BP3-overexpressing THP-1 cells demonstrating significantly elevated K48-linked ubiquitination levels versus controls.
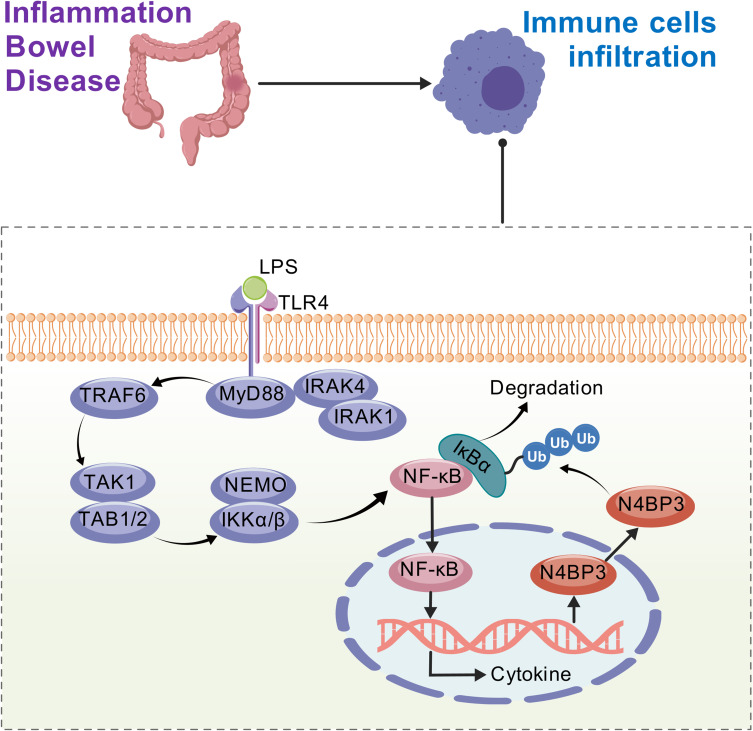
Conclusion: LPS upregulates N4BP3 expression, which subsequently enhances K48-linked ubiquitination of IκBα, leading to NF-κB pathway activation, and exacerbating IBD progression. These findings suggest N4BP3 as a potential therapeutic target for developing novel IBD treatments.
Keywords: IκBα; N4BP3; NF-κB; TLR4; inflammatory bowel disease; ubiquitination.
© 2025 Jiang et al.
Conflict of interest statement
The authors have no relevant financial or non-financial interests to disclose.
Figures
Similar articles
-
N4BP3 facilitates NOD2-MAPK/NF-κB pathway in inflammatory bowel disease through mediating K63-linked RIPK2 ubiquitination.Cell Death Discov. 2024 Oct 17;10(1):440. doi: 10.1038/s41420-024-02213-x. Cell Death Discov. 2024. PMID: 39420190 Free PMC article.
-
TRIM52 aggravated inflammation and pyroptosis in dextran sulfate sodium-induced inflammatory bowel disease through activation of the TLR4/NF-κBs pathway.Allergol Immunopathol (Madr). 2023 Jan 1;51(1):159-167. doi: 10.15586/aei.v51i1.737. eCollection 2023. Allergol Immunopathol (Madr). 2023. PMID: 36617836
-
Fufangxiaopi formula alleviates DSS-induced colitis in mice by inhibiting inflammatory reaction, protecting intestinal barrier and regulating intestinal microecology.J Ethnopharmacol. 2024 Jan 30;319(Pt 3):117365. doi: 10.1016/j.jep.2023.117365. Epub 2023 Oct 30. J Ethnopharmacol. 2024. PMID: 38380568
-
Ubiquitin-Fold Modifier-1 Participates in the Diabetic Inflammatory Response by Regulating NF-κB p65 Nuclear Translocation and the Ubiquitination and Degradation of IκBα.Drug Des Devel Ther. 2020 Feb 25;14:795-810. doi: 10.2147/DDDT.S238695. eCollection 2020. Drug Des Devel Ther. 2020. PMID: 32158197 Free PMC article.
-
Cinnamaldehyde Ameliorates Dextran Sulfate Sodium-Induced Colitis in Mice by Modulating TLR4/NF-κB Signaling Pathway and NLRP3 Inflammasome Activation.Chem Biodivers. 2023 Feb;20(2):e202200089. doi: 10.1002/cbdv.202200089. Epub 2023 Jan 27. Chem Biodivers. 2023. PMID: 36653304
Cited by
-
Mechanism of action of heat-clearing and detoxifying herbs in the treatment of erosive gastritis.World J Gastroenterol. 2025 Aug 7;31(29):110133. doi: 10.3748/wjg.v31.i29.110133. World J Gastroenterol. 2025. PMID: 40799369 Free PMC article. Review.
References
-
- Gaya DR, Russell RK, Nimmo ER, et al. New genes in inflammatory bowel disease: lessons for complex diseases? Lancet. 2006;367(9518):1271–1284. - PubMed
LinkOut - more resources
Full Text Sources
