. 2025 Apr 24;28(6):112526.
doi: 10.1016/j.isci.2025.112526. eCollection 2025 Jun 20.

STEAP3 promotes triple-negative breast cancer growth through the FGFR1-mediated activation of PI3K/AKT/mTOR signaling

Affiliations

STEAP3 promotes triple-negative breast cancer growth through the FGFR1-mediated activation of PI3K/AKT/mTOR signaling

Lifang Yuan et al. iScience. .

Abstract

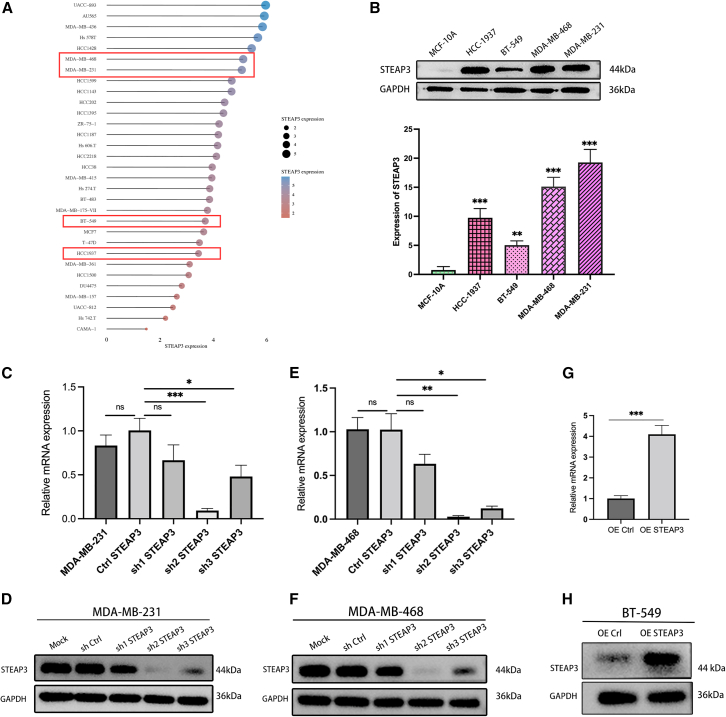
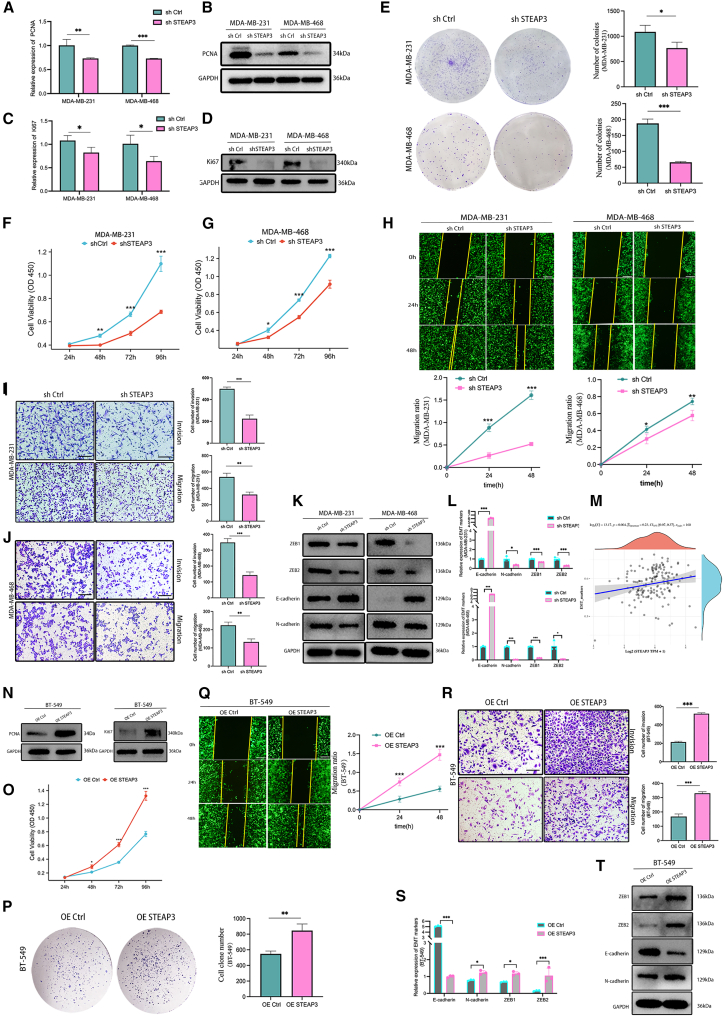
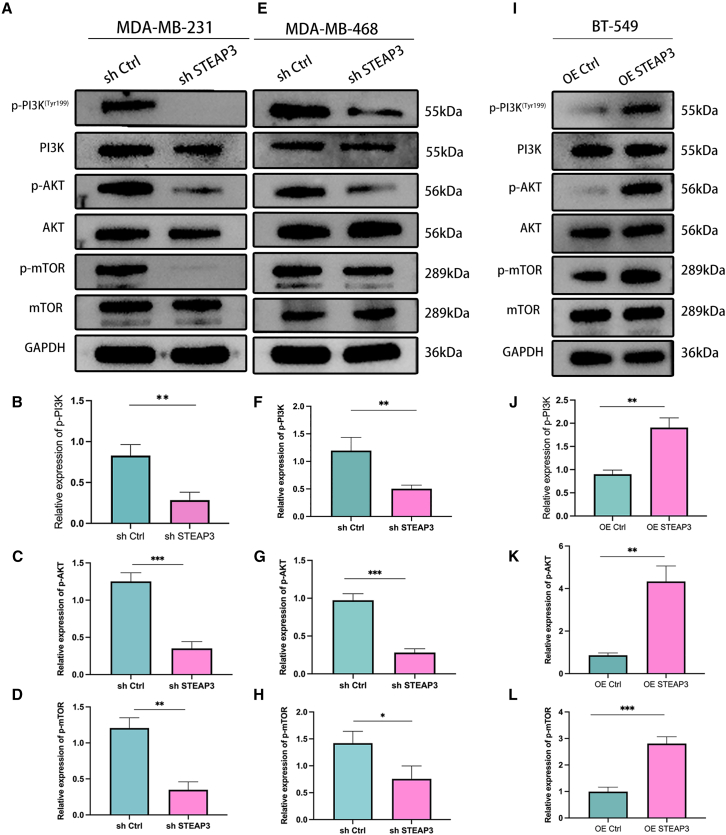
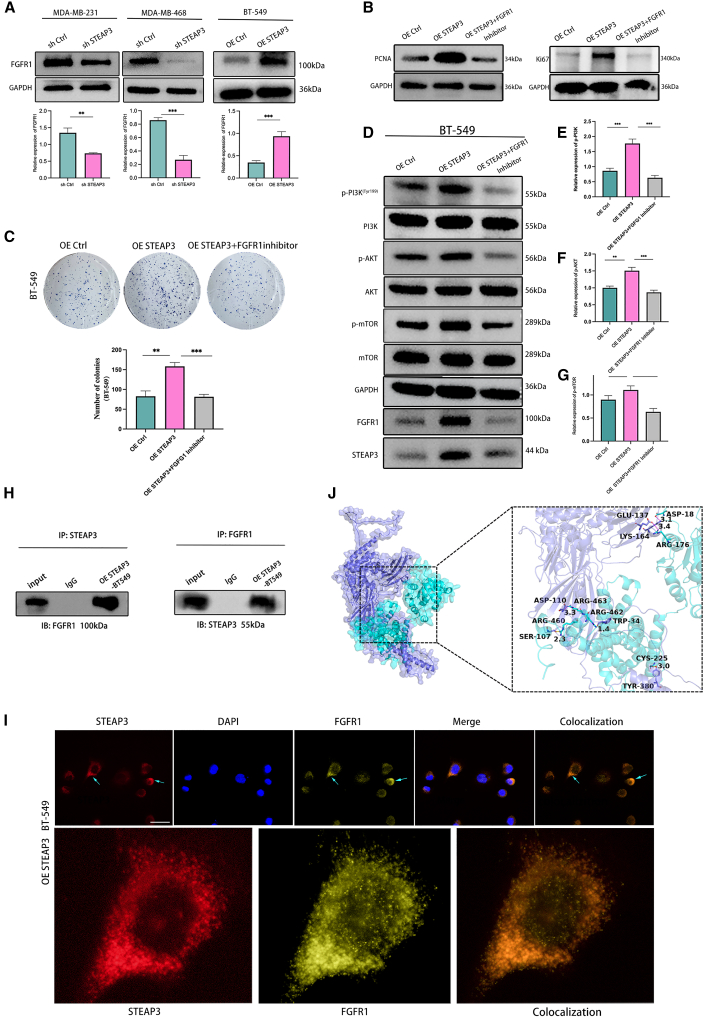
Triple-negative breast cancer (TNBC) is a highly aggressive subtype with a poor prognosis and lacks effective targeted therapies. Six-transmembrane epithelial antigen of prostate 3(STEAP3) is specifically overexpressed in TNBC, but its precise role and molecular mechanisms remain unclear. Here, we show that STEAP3 is positively correlated with proliferation markers in TNBC, but not in non-TNBC. Further assays revealed that STEAP3 significantly enhances TNBC cell proliferation, invasion, and metastasis in vitro. Mechanistically, STEAP3 promotes TNBC progression by stabilizing FGFR1 and subsequently activating the PI3K/AKT/mTOR pathway. In xenograft models, STEAP3 knockdown suppressed tumor growth and reduced the expression of proliferation markers, consistent with in vitro findings. These results demonstrate STEAP3 as a key regulator of TNBC progression via FGFR1-mediated PI3K/AKT/mTOR signaling and highlight its potential as a promising therapeutic target.

Keywords: Cancer; Cell biology; Molecular biology.


Conflict of interest statement

The authors declare no competing interests.

Figures

None
Graphical abstract
Figure 1
Figure 1
STEAP3 levels are significantly correlated with PCNA and Ki67 and elevated in the serum of patients with TNBC (A and B) STEAP3 expression was positively correlated with that of Ki67 and PCNA in the TCGA for TNBC but not patients with non-TNBC (C and D). (E and F) STEAP3 expression was positively correlated with that of Ki67 and PCNA in the GEO dataset for TNBC. (G) Serum STEAP3 levels were compared between patients with TNBC, non-TNBC, and benign breast lesion. Data are presented as mean ± SD (TNBC: n = 27; non-TNBC: n = 43; benign lesions: n = 12) (∗∗∗p < 0.001, NSp > 0.05).
Figure 2
Figure 2
Cell line election and confirmation of STEAP3 KD and OE (A) STEAP3 mRNA levels were analyzed in 31 breast cancer cell lines in the CCLE database. (B) STEAP3 protein levels in four TNBC cell lines and control breast cells were assessed through Western immunoblotting. (C–H) mRNA and protein level confirmation of the efficiency of STEAP3 KD in MDA-MB-231 and MDA-MB-468 cells and of its OE in BT-549 cells. Data are presented as mean ± SD (∗p < 0.05, ∗∗p < 0.01, ∗∗∗p < 0.001, NSp > 0.05).
Figure 3
Figure 3
Modulating STEAP3 expression alters breast cancer cell proliferative, migratory, invasive, and EMT activity in vitro (A–M) Knockdown Effects: (A-G) The effects of STEAP3 KD on MDA-MB-231 and MDA-MB-468 cell proliferative activity were assessed through analyses of Ki67 and PCNA expression, CCK-8 assays, and colony formation assays. (H) The effects of STEAP3 KD on migration in a wound healing assay. Scale bars: 50 μm. (I–J) The effects of STEAP3 KD on invasion and migration in Transwell assays. Scale bars: 25 μm. (K–M) Effects of STEAP3 KD on EMT marker expression (E-cadherin, N-cadherin, ZEB1, ZEB2) as confirmed through RT-qPCR, Western immunoblotting, and TCGA database analyses. (N–T) Overexpression Effects: (N–P) The effects of STEAP3 OE on BT-549 cell proliferative activity were assessed through analyses of Ki67 and PCNA expression, CCK-8 assays, and colony formation assays. (Q) The effects of STEAP3 OE on migration in a wound healing assay. Scale bars: 50 μm. (R) The effects of STEAP3 OE on invasion and migration in Transwell assays. Scale bars: 25 μm. (S and T) Effects of STEAP3 OE on EMT marker levels were assessed via RT-qPCR and Western immunoblotting. Data are presented as mean ± SD (∗p < 0.05, ∗∗p < 0.01, ∗∗∗p < 0.001).
Figure 4
Figure 4
4D label-free proteomics analysis of the changes in TNBC cells following STEAP3 KD (A) Protein abundance changes following STEAP3 knockdown in MDA-MB-231 cells are presented with a heatmap revealing clear differences when comparing the sh Ctrl and sh-STEAP3 groups. (B) Changes in the subcellular distributions of proteins in response to STEAP3 KD are sown, emphasizing changes in the proteins found in the cytosol and nucleus. (C) A Circos plot highlighting GO terms enriched following the KD of STEAP3, highlighting impacted cellular components, particularly the cell membrane. (D) A bar chart showing the biological pathways most impacted by STEAP3 KD, including several associated with cell structure and signaling. (E) Scatterplots showing KEGG pathways significantly enriched by STEAP3 KD. (F and G) The KEGG pathways most substantially altered in terms of protein quantity, highlighting the top 20 most altered pathways including the PI3K/AKT pathway, metabolic pathways, and pathways in cancer. (H) Differentially expressed proteins following STEAP3 KD are presented with a volcano plot, revealing the most upregulated and downregulated genes, including a pronounced reduction in FGFR1 expression (p < 0.05), (I and J) FGFR1 expression levels were compared in the shCtrl and shSTEAP3 groups, with the top 9 most significantly downregulated genes being displayed. Data are presented as mean ± SD (∗∗p < 0.01, ∗∗∗p < 0.001).
Figure 5
Figure 5
Altering STEAP3 expression in TNBC cells modulates PI3K/AKT/mTOR pathway activity (A–D) Western immunoblotting was used following the KD of STEAP3 to assess the relative levels of p-PI3K/PI3K, p-AKT/AKT, and p-mTOR/mTOR in MDA-MB-231 cells. (E–H) A similar approach was used to analyze MDA-MB-468 cells following STEAP3 KD. (I–L) The effects of STEAP3 OE on the levels of components of the PI3K/AKT/mTOR signaling pathway in BT-549 cells. Protein levels are given as ratios normalized to the total levels of the corresponding protein. Data are presented as mean ± SD (∗p < 0.05, ∗∗p < 0.01, ∗∗∗p < 0.001).
Figure 6
Figure 6
STEAP3 controls the progression of TNBC through the FGFR1-mediated activation of PI3K/AKT/mTOR signaling (A) Western immunoblotting was used to analyze FGFR1 changes following STEAP3 KD (MDA-MB-231 and MDA-MB-468 cells) or OE (BT-549 cells). (B) Western immunoblotting results revealing the effects of STEAP3 OE on Ki67 and PCNA levels in BT-549 cells relative to the OE Ctrl, OE STEAP3, and OE STEAP3+FGFR1inhibitor groups (AZD4547). (C) Colony formation assay results for BT-549 cells in the OE Ctrl, OE STEAP3, and OE STEAP3+FGFR1inhibitor groups. (D–G) Western immunoblotting comparing levels of PI3K/AKT/mTOR pathway components within BT-549 cells in the OE Ctrl, OE STEAP3, and OE STEAP3+FGFR1inhibitor groups with corresponding quantification of phosphorylation levels. (H) Co-IP results confirming interactions between STEAP3 and FGFR1 within BT-549 cells overexpressing STEAP3. (I) Immunofluorescence results showing STEAP3 and FGFR1 colocalization within the cytoplasm of STEAP3 OE BT-549 cells (Green arrow). Scale bars: 25 μm. (J) Molecular docking results showing the FGFR1 protein is represented as a slatecartoon model, STEAP3 protein is shown as a cyan cartoon model and their binding sites are shownas the corresponding-colored stick structure. Data are presented as mean ± SD (∗p < 0.05, ∗∗p < 0.01, ∗∗∗p < 0.001).
Figure 7
Figure 7
STEAP3 inhibits in vivo TNBC tumor growth (A–D) Significant reductions in tumor weights and volumes were evident in the shSTEAP3 group as compared to shCtrl. (E and F) STEAP3 levels in tumor xenografts were confirmed through Western immunoblotting. (G–J) Western immunoblotting was used to assess FGFR1 and STEAP3 protein levels and those of p-PI3K/PI3K, p-AKT/AKT, and p-mTOR/mTOR within tumor xenografts (“+” indicates high expression; “-” indicates the low expression of STEAP3 and FGFR1). (K–L) Representative IHC staining images showing STEAP3 expression in MDA-MB-231 xenograft tumors from shCtrl and shSTEAP3 groups, with quantification of IHC scores for 10 paired xenograft tumors presented as a paired dot plot. Scale bars: 25 μm. (M) The knockdown of STEAP3 in MDA-MB-231 led to a reduction in PCNA and Ki67 protein levels relative to shCtrl cells in xenograft tumor. Scale bars: 50 μm. (N) The proposed functions of STEAP3 in TNBC. Data are presented as mean ± SD (∗p < 0.05, ∗∗p < 0.01. ∗∗∗p < 0.001).

Similar articles

References

    1. Sung H., Ferlay J., Siegel R.L., Laversanne M., Soerjomataram I., Jemal A., Bray F. Global cancer statistics 2020: GLOBOCAN estimates of incidence and mortality worldwide for 36 cancers in 185 countries. CA Cancer J. Clin. 2021;71:209–249. doi: 10.3322/caac.21660. - DOI - PubMed
    1. Siegel R.L., Giaquinto A.N., Jemal A. Cancer statistics, 2024. CA Cancer J. Clin. 2024;74:12–49. doi: 10.3322/caac.21820. - DOI - PubMed
    1. Zhou Y., Yang J., Chen C., Li Z., Chen Y., Zhang X., Wang L., Zhou J. Polyphyllin Ⅲ-Induced ferroptosis in MDA-MB-231 triple-negative breast cancer cells can be protected against by KLF4-mediated upregulation of xCT. Front. Pharmacol. 2021;12 doi: 10.3389/fphar.2021.670224. - DOI - PMC - PubMed
    1. Wei Y., Zhu Z., Hu H., Guan J., Yang B., Zhao H. Eupaformosanin induces apoptosis and ferroptosis through ubiquitination of mutant p53 in triple-negative breast cancer. Eur. J. Pharmacol. 2022;924 doi: 10.1016/j.ejphar.2022.174970. - DOI - PubMed
    1. Yao X., Xie R., Cao Y., Tang J., Men Y., Peng H., Yang W. Simvastatin induced ferroptosis for triple-negative breast cancer therapy. J. Nanobiotechnol. 2021;19:311. doi: 10.1186/s12951-021-01058-1. - DOI - PMC - PubMed

LinkOut - more resources