. 2025 Apr 29;28(6):112555.
doi: 10.1016/j.isci.2025.112555. eCollection 2025 Jun 20.

Targeting SUMOylation in ovarian cancer: Sensitivity, resistance, and the role of MYC

Affiliations

Targeting SUMOylation in ovarian cancer: Sensitivity, resistance, and the role of MYC

Samantha Littler et al. iScience. .

Abstract

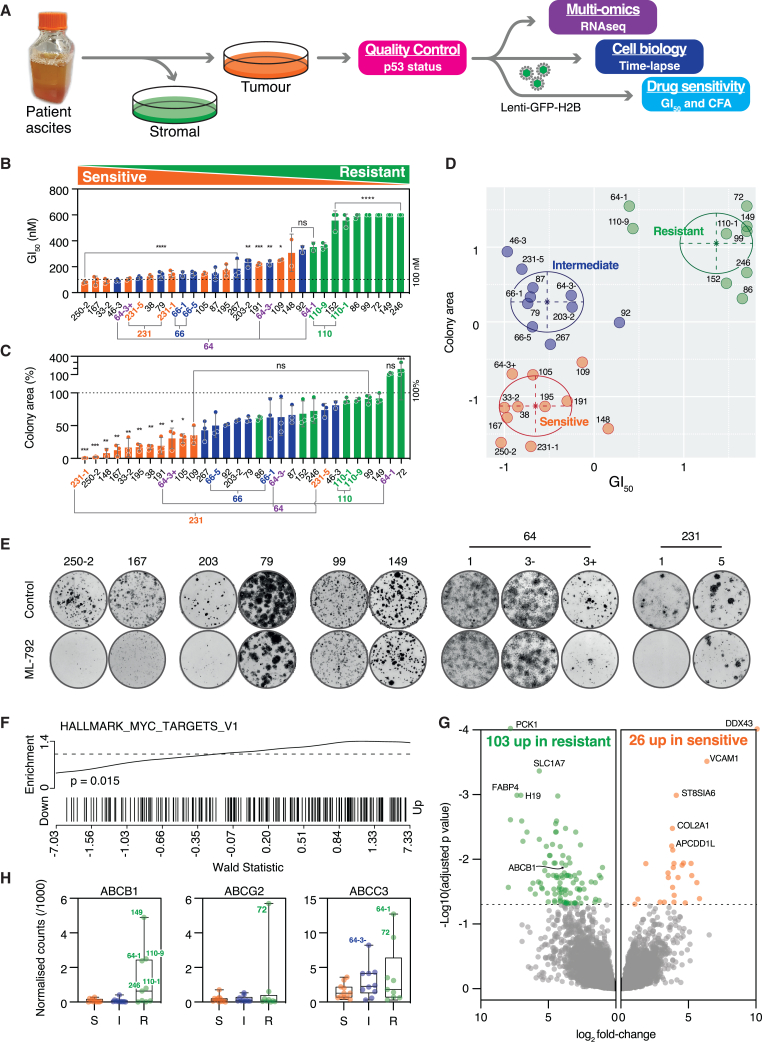
Cells overexpressing MYC depend on SUMOylation for survival and cell division. To assess the therapeutic potential of SUMO inhibition, we screened 30 patient-derived ovarian cancer models (OCMs) with the SUMO-activating enzyme inhibitor ML-792. While most were resistant, seven displayed intermediate sensitivity, and a further five were particularly sensitive, with sensitivity accompanied by mitotic errors, polyploidy, apoptosis, and PML body expansion. Resistance was linked to ABCB1 upregulation, and inhibiting drug efflux sensitized eight resistant OCMs. MYC target genes were enriched in sensitive models, consistent with MYC being a potential driver of response. SUMO inhibition induced an adaptive transcriptional response in resistant cells, but this was attenuated in MYC-overexpressing cells, raising the possibility that transcriptional interference disrupts the homeostatic controls required to buffer the inhibition of SUMO signaling. SUMO sensitivity did not overlap with PARP inhibitor sensitivity, supporting the therapeutic potential of apex SUMO inhibitors to target a subset of homologous-recombination-proficient ovarian cancers.

Keywords: Cancer; Molecular biology; Transcriptomics.


Conflict of interest statement

The authors have no competing interests to declare that are relevant to the content of this article.

Figures

None
Graphical abstract
Figure 1
Figure 1
An apex SUMO inhibitor induces cell division failure in MYC-High cells (A) Schematic of FC-MYC cells showing mutated MYC alleles (orange) and sequestration of TetR repressors (blue) from the TetO2 operator (purple) by Tetracycline (red) to enable the expression of a MYC transgene (green). (B) Canonical SUMO pathway illustrating how SUMO proteins (orange) are activated by the SAE E1 enzyme (purple), transferred to the Ubc9 E2 conjugating enzyme (blue), then ligated to a substrate (green) aided by an E3 ligase (yellow). SUMO is recycled via SENP-mediated hydrolysis (red). ML-792 blocks SUMO signaling via an adduct mechanism that sequesters SUMO proteins. (C) Colony formation assay of FC-MYC cells ± tetracycline, to create MYC-Low and MYC-High states, exposed ± ML-792. (D) DNA content histograms of MYC-Low (L) and MYC-High (H) cells exposed to ML-792 for 72 h, and bar graphs quantifying DNA content and apoptosis (sub-2n) from three biological replicates. two-way ANOVA with Šídák’s multiple comparisons; ∗∗∗∗p < 0.0001. (E) Cell fate profiles derived from time-lapse microscopy of MYC-Low/High cells exposed to ML-792, with horizontal bars representing single cells (50 per condition) and colors indicating cell behavior. Numbers in colored boxes show the percentage of cells with the indicated behavior. (F) Time-lapse image analysis of FC-MYC cells expressing GFP-tagged histone, quantifying mitotic abnormalities. Each column represents a single cell with phenotype totals on the right. (G) Immunofluorescence images of mitotic FC-MYC cells exposed to ML-792 for 48 h, stained to detect DNA (purple) and Aurora A (green), and bar graph quantifying the number of spindle poles. Scale bar: 50 μm. Data are mean ± SD from three biological replicates. (H) Fluorescence images of interphase MYC-High cells treated with ML-792 for 48 h were stained to detect DNA, with bar graphs quantifying the percentage of micronuclei and chromatin bridges. Scale bars: 50 μm (top) and 20 μm (middle and bottom). Data are mean ± SD from three biological replicates with 1000 cells (micronuclei) or 300 cells (bridges) counted per condition. ML-792 was used at 25 nM for all experiments. Two-way ANOVA with Tukey's multiple comparisons ; ∗∗p < 0.01, ∗∗∗p < 0.001. See also Figures S1 and S2.
Figure 2
Figure 2
A subset of ovarian cancer cell lines is sensitive to the inhibition of SUMO signaling (A) (Left) Mutation profile of selected ovarian cancer cell lines., ∗ = missense mutation of unknown significance. (Right) Expression of MYC and MYC Hallmark Genes V1 based on RNA-sequencing data, and Myc and Sae2 protein levels determined by LICOR immunoblotting. (B) Bar graph of ML-792 GI50 values derived from 96-h proliferation assays, showing mean ± s.e.m from three biological replicates. (C) Representative colony formation assays. (D) xy plot of mean GI50 values against colony area expressed as a percentage of untreated controls. r provides Pearson correlation value, ∗∗p < 0.01. (E) DNA content histograms and (F) cell fate profiles comparing exemplar lines. ML-792 was used at 200 nM for all experiments, and cell fate profiles are as described in Figure 1E. See also Figure S3.
Figure 3
Figure 3
Screen 1: A subset of patient-derived ovarian cancer models is sensitive to the inhibition of SUMO signaling (A) Workflow for generating and characterizing patient-derived ovarian cancer models (OCMs). (B and C) Rank ordered bar graphs showing ML-792 sensitivity of 30 OCMs, based on GI50 values determined using a 120-h GFP-H2B-based proliferation assay over a range of drug concentrations (B), and a clonogenic assay performed in the presence of 100 nM ML-792, showing colony formation area expressed as a percentage of untreated cells (C). OCMs derived from the same patient are highlighted, and colors correspond to categories in (D). Bars are mean ± s.e.m from three biological replicates. In (B) and (C), statistical comparisons are to OCMs 110-9 and 149, respectively. ∗p < 0.05, ∗∗p < 0.01, ∗∗∗p < 0.001, ∗∗∗∗p < 0.0001, ns: p > 0.05. (D) xy graph plotting GI50 against colony area, highlighting three clusters identified by multivariate mixture modeling, corresponding to OCMs either sensitive (orange), resistant (green), or with intermediate sensitivity (blue). (E) Representative colony formation assays performed at 100 nM ML-792. (F and G) (F) Enrichment of Hallmark MYC targets V1 (p = 0.015) and (G) volcano plot shows differentially expressed genes identified by comparing transcriptomes of resistant and sensitive OCMs. (H) Box-and-whisker plots show normalized read counts for indicated ABC family members in sensitive (S), intermediate (I), and resistant (R) OCMs. See also Table S1.
Figure 4
Figure 4
Inhibiting drug efflux can reverse SAE inhibitor resistance (A–E) Analysis of OCM.72 exposed to 500 nM ML-792 and 250 nM elacridar as indicated, showing representative colony formation assay (A); DNA content histograms after 96-h exposure (B); bar graph quantitating cells with DNA contents of 2n (blue), 4n (yellow), 8n (red) or <2n (sub 2n; green) (C); immunofluorescence images of nuclei stained to detect PML bodies highlighting small (green arrows) and large (orange arrows) bodies, scale bar: 20 μm (D); and bar graphs quantitating nuclear area and large PML bodies (E). (F) Analysis of longitudinal OCMs 231-1 and 231-5 exposed to 100 nM ML-792 and 250 nM elacridar as indicated, showing representative colony formation assay and bar graphs quantitating percentage colony area relative to untreated cells. Data are mean ± SD from three biological replicates. One-way ANOVA with Dunnett’s multiple comparisons; ∗p < 0.05, ∗∗p < 0.01, ∗∗∗p < 0.001.
Figure 5
Figure 5
Screen 2: inhibition of drug efflux activity to redefine ML-792 sensitivity (A) xy graph plotting GI50 values derived from 144-h GFP-H2B-based proliferation assays over a range of drug concentrations, against colony area at 100 nM ML-792 as a percentage of untreated controls. (B and C) (B) xy graph plotting percentage colony area at 100 nM ML-792 for Screen 1 versus Screen 2. r provides Pearson correlation value, ∗∗∗∗p < 0.0001 (C) xy graph plotting the ML-792:ML-792+elacridar (Ela) ratios derived from Screen 2, showing GI50 values against percentage colony area at 100 nM ML-792, highlighting elacridar responders. (D) xy graph showing percentage colony area at 100 nM ML-792 versus 100 nM ML-792 plus 250 nM elacridar. Line shows a linear regression with 90% confidence bands. The top-10 elacridar responders are highlighted with an “e” and a further three OCMs that move from resistant to intermediate are marked with an “∗”. In (A–D), OCMs are categorized based on colony area at 100 nM ML-792 as sensitive (orange, <20%), intermediate (blue, 20–60%) or resistant (green, >60%). See also Figures S4–S6.
Figure 6
Figure 6
Ovarian cancer models harbor multiple, non-overlapping vulnerabilities (A) (Left) xy plot of colony formation area (CFA) values converted to z-scores, comparing ML-792-sensitivity at 100 nM versus 500 nM, both in the presence of elacridar. Colors indicate categories described in Figure 5D. Line shows a linear regression with 95% confidence bands. r represents Pearson correlation value, ∗∗∗p < 0.001. (Middle) Volcano plot showing differentially expressed genes identified using 100 nM ML-792 plus elacridar z-scores as a continuous variable, highlighting 28 downregulated and 74 upregulated genes associated with increasing resistance to ML-792. (Right) TRANSFAC analysis of 74 upregulated genes, with symbol size indicating number of genes. (B) Schematic conceptualizing coordination of TGFβ/SMAD and MYC signaling via SNIP1 SUMOylation. (C) (Left) Exemplar GFP-H2B-based, 96-h proliferation curves of FC-MYC cells ± tetracycline following siRNA-mediated inhibition of SNIP1 and SMAD2, with green object count (GOC) determined by time-lapse microscopy and normalized to the T0 value, i.e., when imaging started. (Right) Mean area under the curve (AUC) values ±SD from three biological replicates. ∗∗∗p < 0.001; ns: p > 0.05. (D) xy graph plotting proliferation of 20 OCMs following siRNA-mediated inhibition of SNIP1 and SMAD2. Values are AUC derived from 144-h GFP-H2B-based proliferation assays. Bubble size represents the percentage colony formation area (CFA) at 100 nM ML-792 (M) + 250 nM elacridar (E), and colors represent ML-792-sensitivity categories described in Figure 5D. Line shows a linear regression with 95% confidence intervals. Data are mean ± SD for three biological replicates. (E) Exemplar proliferation curves used to generate AUC values in (D), with GOC determined by time-lapse microscopy and normalized to the T0 value. Mean ± SD for two technical replicates. (F) Cell fate profiles derived from time-lapse microscopy analysis of OCMs indicated, with profiles as described in Figure 1E. (G) Bar graphs quantifying abnormal cell divisions during the 1st, 2nd, 3rd, or 4th mitosis. See also Figure S6 and Table S3.
Figure 7
Figure 7
MYC overexpression attenuates an adaptive response induced by the inhibition of SUMO signaling (A) Principal component analysis of RNA sequencing data derived from FC-MYC cells ± tetracycline to create MYC-Low and MYC-High states and exposed to ML-792 for 24 h. The three biological replicates are shown for each condition. (B) Volcano plots show differentially expressed genes comparing the conditions indicated. (C) Heatmap of 132 differentially regulated genes identified by interaction analysis, clustered using K-means. (D) Average z-scores of the four clusters described in (C). (E) (Left) Boxplot shows MYC read counts. (Right) Normalized MYC read counts distinguishing between endogenous and transgenic mRNA. Values are mean ± SD from three biological replicates. (F and G) (F) Nucleotide and amino acid sequences of MYC, showing the three silent point mutations in the transgenic allele, and the mutation introduced at the endogenous alleles by CRISPR/Cas9-mediated gene editing. (G) Model showing negative feedback loop whereby SUMO signaling inhibits MYC expression. See also Figure S7.

References

    1. Kress T.R., Sabò A., Amati B. MYC: connecting selective transcriptional control to global RNA production. Nat. Rev. Cancer. 2015;15:593–607. doi: 10.1038/nrc3984. - DOI - PubMed
    1. Dhanasekaran R., Deutzmann A., Mahauad-Fernandez W.D., Hansen A.S., Gouw A.M., Felsher D.W. The MYC oncogene — the grand orchestrator of cancer growth and immune evasion. Nat. Rev. Clin. Oncol. 2022;19:23–36. doi: 10.1038/s41571-021-00549-2. - DOI - PMC - PubMed
    1. Pelengaris S., Littlewood T., Khan M., Elia G., Evan G. Reversible activation of c-Myc in skin: induction of a complex neoplastic phenotype by a single oncogenic lesion. Mol. Cell. 1999;3:565–577. doi: 10.1016/s1097-2765(00)80350-0. - DOI - PubMed
    1. Felsher D.W., Bishop J.M. Reversible tumorigenesis by MYC in hematopoietic lineages. Mol. Cell. 1999;4:199–207. doi: 10.1016/s1097-2765(00)80367-6. - DOI - PubMed
    1. Jain M., Arvanitis C., Chu K., Dewey W., Leonhardt E., Trinh M., Sundberg C.D., Bishop J.M., Felsher D.W. Sustained loss of a neoplastic phenotype by brief inactivation of MYC. Science. 2002;297:102–104. doi: 10.1126/science.1071489. - DOI - PubMed

LinkOut - more resources