. 2025 May 15;16(5):99473.
doi: 10.4239/wjd.v16.i5.99473.

Effect of ranibizumab on diabetic retinopathy via the vascular endothelial growth factor/STAT3/glial fibrillary acidic protein pathway

Affiliations

Effect of ranibizumab on diabetic retinopathy via the vascular endothelial growth factor/STAT3/glial fibrillary acidic protein pathway

Ye-Ting Lin et al. World J Diabetes. .

Abstract

Background: Diabetic retinopathy (DR) is the leading cause of vision loss in patients with diabetes. The vascular endothelial growth factor (VEGF) pathway plays a critical role in the pathogenesis of DR, and ranibizumab, an anti-VEGF agent, has shown promise in its treatment. Signal transducer and activator of transcription 3 (STAT3) is involved in inflammatory processes and cellular signaling, while glial fibrillary acidic protein (GFAP) is a marker of glial cell activation, both contributing to retinal damage in DR. However, the mechanisms by which ranibizumab affect early-stage DR through the VEGF/STAT3/GFAP pathway are not fully understood.

Aim: To investigate the role of ranibizumab in early DR via the VEGF/STAT3/GFAP pathway.

Methods: Adult retinal pigment epithelial 19 (ARPE-19) cells and human retinal microvascular endothelial cells (HRMECs) were cultured under high-glucose conditions to simulate a diabetic environment. The effects of ranibizumab on cytokine mRNA and protein expression were analyzed by quantitative polymerase chain reaction and Western blot analysis. A diabetic rat model was induced with streptozotocin (60 mg/kg). Retinal changes, including retinal ganglion cell (RGC) apoptosis, vascular alterations, and cytokine expression, were evaluated using fundus fluorescein angiography, hematoxylin and eosin and periodic acid Schiff staining, immunofluorescence, confocal imaging, and Western blot analysis.

Results: High-glucose conditions significantly increased the mRNA and protein levels of VEGF, STAT3, GFAP, and other cytokines in ARPE-19 and HRMECs. However, these levels were partially suppressed by ranibizumab. RGC apoptosis, vascular leakage, and elevated cytokine expression were observed during early-stage DR in diabetic rats. Ranibizumab treatment in diabetic rats reduced cytokine expression, restored RGCs, and repaired vascular networks.

Conclusion: Intravitreal ranibizumab modulates the VEGF/STAT3/GFAP pathway, suppresses cytokine expression, and promotes retinal repair, effectively delaying or preventing early DR progression.

Keywords: Diabetic retinopathy; Early stage; Glial fibrillary acidic protein; Ranibizumab; Signal transducer and activator of transcription 3; Vascular endothelial growth factor.


Conflict of interest statement

Conflict-of-interest statement: The authors have no conflicts of interest to declare.

Figures

Figure 1
Figure 1
Effect of ranibizumab on the viability of adult retinal pigment epithelial 19 cells and human retinal microvascular endothelial cells. Cell viability was assessed using the Cell Counting Kit-8 assay (n = 3, independent experiments). A: Effect of ranibizumab (0 mg/mL, 0.0625 mg/mL, 0.125 mg/mL, or 025 mg/mL) treatment on adult retinal pigment epithelial 19 (ARPE-19) cell viability; B: Effect of ranibizumab (0 mg/mL, 0.0625 mg/mL, 0.125 mg/mL, or 025 mg/mL) treatment on human retinal microvascular endothelial cell (HRMEC) viability. All results are expressed as the mean ± SD. dP < 0.0001. 1P vs 24 hour group. 2P vs 48 hour group. NC: Untreated group.
Figure 2
Figure 2
mRNA expression of vascular endothelial growth factor, interleukin 6, cluster of differentiation 18, intercellular adhesion molecule, tumor necrosis factor alpha, and signal transducer and activator of transcription 3 in adult retinal pigment epithelial 19 cells and human retinal microvascular endothelial cells. Untreated (NC) (5.5 mmol/L glucose), NC + ranibizumab (5.5 mmol/L glucose + 0.125 mg/mL ranibizumab), high glucose (Hg) (25 mmol/L glucose), and Hg + ranibizumab (25 mmol/L glucose + 0.125 mg/mL ranibizumab). A: Ratios of the mRNA expression of vascular endothelial growth factor (VEGF), interleukin 6 (IL-6), cluster of 18 differentiation (CD18), intercellular adhesion molecule (ICAM), tumor necrosis factor alpha (TNF-α), and signal transducer and activator of transcription 3 (STAT3) in different adult retinal pigment epithelial 19 (ARPE-19) groups; B: Ratios of mRNA expression of VEGF, IL-6, CD18, ICAM, TNF-α, and STAT3 in different human retinal microvascular endothelial cell (HRMEC) groups. All results are expressed as the mean ± SD. aP < 0.05. bP < 0.01. 1P vs NC group. 2P vs Hg group.
Figure 3
Figure 3
Expression of glial fibrillary acidic protein, signal transducer and activator of transcription 3 (STAT3), and phosphorylated STAT3 proteins in adult retinal pigment epithelial 19 cells and human retinal microvascular endothelial cells. Untreated (NC) (5.5 mmol/L glucose), NC + ranibizumab (5.5 mmol/L glucose + 0.125 mg/mL ranibizumab), high glucose (Hg) (25 mmol/L glucose), and Hg + ranibizumab (25 mmol/L glucose + 0.125 mg/mL ranibizumab). A: Expression of glial fibrillary acidic protein (GFAP), signal transducer and activator of transcription 3 (STAT3), and phosphorylated STAT3 (pSTAT3) proteins in adult retinal pigment epithelial 19 (ARPE-19) cells were detected by Western blot analysis; B: Expression of GFAP, STAT3, and pSTAT3 proteins in human retinal microvascular endothelial cells (HRMECs) were detected by Western blot analysis; C: Ratios of GFAP, STAT3, and pSTAT3 protein expression levels in different groups of ARPE-19 cells; D: Ratios of GFAP, STAT3, and pSTAT3 protein expression levels in different groups of HRMECs. All results are expressed as the mean ± SD. aP < 0.05. bP < 0.01. 1P vs NC group. 2P vs Hg group.
Figure 4
Figure 4
Changes in body weights and blood glucose concentrations of Sprague-Dawley rats within 10 weeks after induction. A: Experimental flowchart: 100 diabetic rats were randomly divided into Groups A, B, C, D, and E, while 20 normal rats with no treatment were assigned to Group F; B: Changes in the body weights of Sprague-Dawley rats in each group; C: Changes in the blood glucose concentrations of Sprague-Dawley rats in each group. All results are expressed as the mean ± SD. aP < 0.05. cP < 0.001. P vs A group. FFA: Fundus fluorescein angiography; STZ: Streptozotocin.
Figure 5
Figure 5
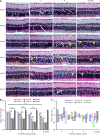
Morphological retinal changes on fundus fluorescein angiography (scale bar: 200 μm). The yellow arrow indicates vessels with increased vascular tortuosity and dilatation. The orange arrow indicates leaky vessels with increased tortuosity and dilatation. The green arrow indicates areas of retinal vascular occlusion.
Figure 6
Figure 6
Hematoxylin and eosin staining and the ratio of retinal ganglion cell (RGC) number to RGC area in each group at each time point. A: Ratio of retinal ganglion cell (RGC) number to RGC area in each group based on retinal tissue hematoxylin and eosin staining (magnification: 400 ×; scale bar: 25 μm); B and C: Ratio of RGC number to RGC area in each group at each time point, respectively. The blue arrows indicate neovascularization buds, while the yellow arrows indicate abnormally dilated microvessels. All results are expressed as the mean ± SD. aP < 0.05. bP < 0.01. cP < 0.001. 1P vs F group. 2P vs C group. 3P vs B group.
Figure 7
Figure 7
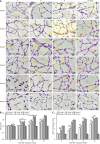
Ratio between the endothelial cell to pericyte ratio and the number of acellular strands. A: Ratio between the endothelial cell to pericyte (E/P) ratio and the number of acellular strands in each group revealed by retinal periodic acid-Schiff staining (magnification: 400 ×; scale bar: 2.5 μm); B and C: Ratio between E/P and the number of acellular strands during the sixth, eighth, and tenth weeks. The yellow arrows indicate the acellular strands, while the orange arrows indicate neovascularization bud. All results are expressed as the mean ± SD. aP < 0.05. bP < 0.01. 1P vs F group. 2P vs B group. 3P vs D group.
Figure 8
Figure 8
Immunohistochemical imaging and the ratio of the number of type IV collagen-positive strands, retinal cells, and area of retinal cells. A: Immunohistochemical imaging of retinal tissues in Sprague-Dawley rats (magnification: 100 ×); B-D: Ratio of the number of type IV collagen-positive strands, retinal cells, and area of retinal cells during the sixth, eighth, and tenth weeks, respectively. The white arrows indicate type IV collagen-positive strands. The yellow arrows indicate areas of vascular permeability. The orange arrows indicate vascular buds. All results are expressed as the mean ± SD. aP < 0.05. bP < 0.01. 1P vs F group. 2P vs B group. 3P vs D group. AT-IV: Anti-IV; CSs: Collagen strands; DAPI: 4’,6-diamidino-2-phenylindole; FITC: Fluorescein isothiocyanate; TL: Tomato lectin; RFC: Retinal cell.
Figure 9
Figure 9
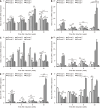
mRNA expression of vascular endothelial growth factor, interleukin 6, cluster of differentiation 18, intercellular adhesion molecule, tumor necrosis factor-alpha, and signal transducer and activator of transcription 3 in the retinal tissues of Sprague-Dawley rats. A: Ratio of vascular endothelial growth factor (VEGF) mRNA expression in the retinal tissue of each group of Sprague-Dawley (SD) rats; B: Ratio of interleukin 6 (IL-6) mRNA expression in the retinal tissue of each group of SD rats; C: Ratio of cluster of differentiation 18 (CD18) mRNA expression in the retinal tissue of each group of SD rats; D: Ratio of intercellular adhesion molecule (ICAM) mRNA expression in the retinal tissue of each group of rats; E: Ratio of tumor necrosis factor alpha (TNF-a) mRNA expression in the retinal tissue of each group of rats; F: Ratio of signal transducer and activator of transcription 3 (STAT3) mRNA expression in the retinal tissue of each group of rats. All results are expressed as the mean ± SD. aP < 0.05. bP < 0.01. 1P vs A group. 2P vs B group. 3P vs C group. 4P vs D group. 5P vs F group.
Figure 10
Figure 10
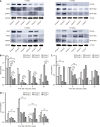
Expression of glial fibrillary acidic protein, signal transducer and activator of transcription 3 (STAT3), and phosphorylated STAT3 proteins in the retinal tissues of each group of Sprague-Dawley rats. A: Detection of glial fibrillary acidic protein (GFAP), signal transducer and activator of transcription 3 (STAT3), and phosphorylated STAT3 (pSTAT3) protein expression in the retinal tissues of Sprague-Dawley (SD) rats using Western blot analysis; B: Ratio of GFAP protein expression in the retinal tissues of each group of SD rats; C: Ratio of STAT3 protein expression in the retinal tissues of each group of SD rats; D: Ratio of pSTAT3 protein expression in the retinal tissues of each group of rats. All results are expressed as the mean ± SD. aP < 0.05. bP < 0.01. 1P vs A group. 2P vs C group. 3P vs D group. 4P vs F group. GAPDH: Glyceraldehyde-3-phosphate dehydrogenase.

Similar articles

References

    1. NCD Risk Factor Collaboration (NCD-RisC) Worldwide trends in diabetes prevalence and treatment from 1990 to 2022: a pooled analysis of 1108 population-representative studies with 141 million participants. Lancet. 2024;404:2077–2093. - PMC - PubMed
    1. Antonetti DA, Silva PS, Stitt AW. Current understanding of the molecular and cellular pathology of diabetic retinopathy. Nat Rev Endocrinol. 2021;17:195–206. - PMC - PubMed
    1. Kwan CC, Fawzi AA. Imaging and Biomarkers in Diabetic Macular Edema and Diabetic Retinopathy. Curr Diab Rep. 2019;19:95. - PubMed
    1. Antar SA, Ashour NA, Sharaky M, Khattab M, Ashour NA, Zaid RT, Roh EJ, Elkamhawy A, Al-Karmalawy AA. Diabetes mellitus: Classification, mediators, and complications; A gate to identify potential targets for the development of new effective treatments. Biomed Pharmacother. 2023;168:115734. - PubMed
    1. Semeraro F, Morescalchi F, Cancarini A, Russo A, Rezzola S, Costagliola C. Diabetic retinopathy, a vascular and inflammatory disease: Therapeutic implications. Diabetes Metab. 2019;45:517–527. - PubMed

LinkOut - more resources