. 2025 Apr 16;10(3):960-978.
doi: 10.1016/j.idm.2025.04.004. eCollection 2025 Sep.

Impact of information dissemination and behavioural responses on epidemic dynamics: A multi-layer network analysis

Affiliations

Impact of information dissemination and behavioural responses on epidemic dynamics: A multi-layer network analysis

Congjie Shi et al. Infect Dis Model. .

Abstract

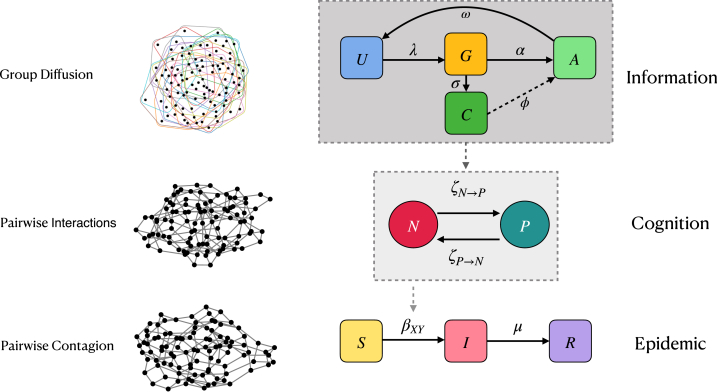
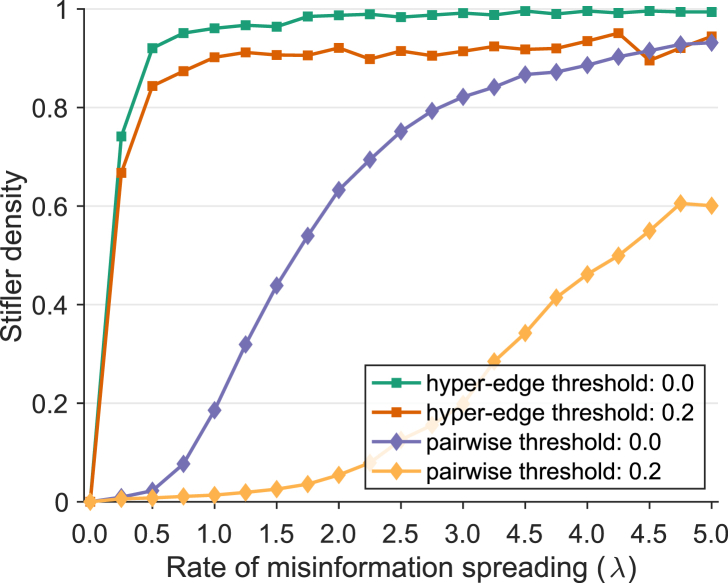
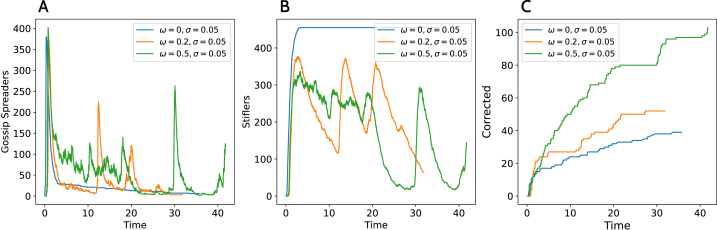
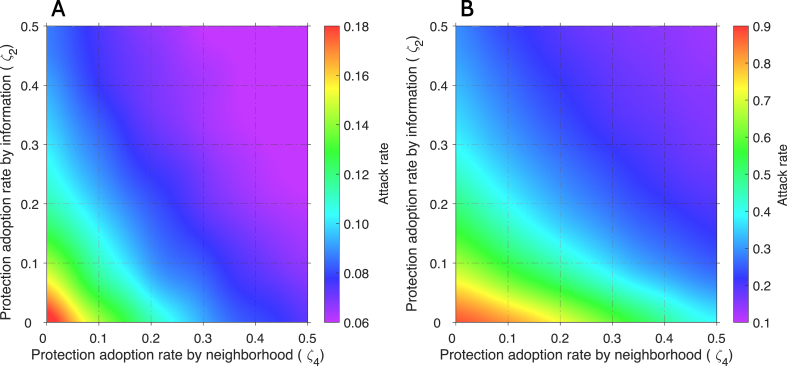
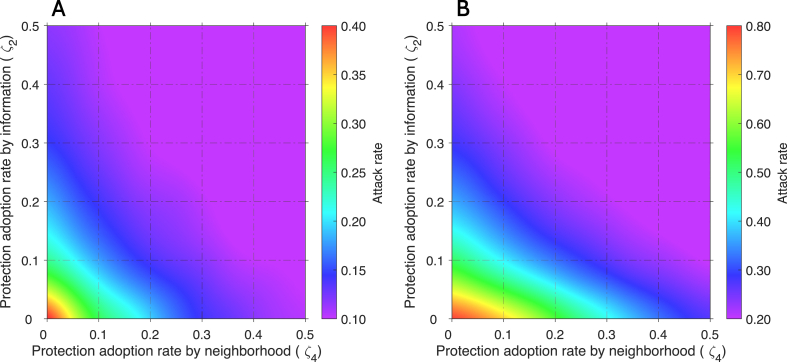
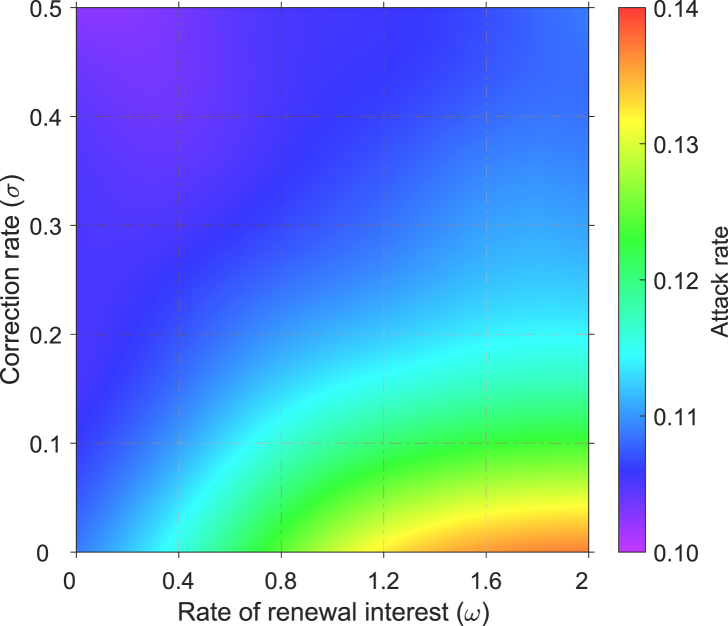
Network models adeptly capture heterogeneities in individual interactions, making them well-suited for describing a wide range of real-world and virtual connections, including information diffusion, behavioural tendencies, and disease dynamic fluctuations. However, there is a notable methodological gap in existing studies examining the interplay between physical and virtual interactions and the impact of information dissemination and behavioural responses on disease propagation. We constructed a three-layer (information, cognition, and epidemic) network model to investigate the adoption of protective behaviours, such as wearing masks or practising social distancing, influenced by the diffusion and correction of misinformation. We examined five key events influencing the rate of information spread: (i) rumour transmission, (ii) information suppression, (iii) renewed interest in spreading misinformation, (iv) correction of misinformation, and (v) relapse to a stifler state after correction. We found that adopting information-based protection behaviours is more effective in mitigating disease spread than protection adoption induced by neighbourhood interactions. Specifically, our results show that warning and educating individuals to counter misinformation within the information network is a more effective strategy for curbing disease spread than suspending gossip spreaders from the network. Our study has practical implications for developing strategies to mitigate the impact of misinformation and enhance protective behavioural responses during disease outbreaks.

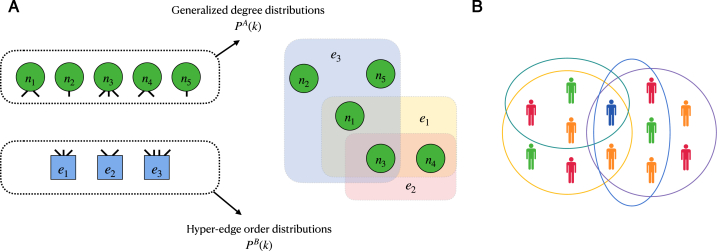
Keywords: 2000 MSC, 92D30; 37N25; 89.75.Fb; 89.75.Hc; 94A17; Behavioural responses; Epidemic dynamics; Hyper-edge networks; Information diffusion; PACS, 87.23.Ge.


Conflict of interest statement

The authors declare that they have no known competing financial interests or personal relationships that could have appeared to influence the work reported in this paper.

Figures

Fig. 1
Fig. 1
Schematic representation of the information, cognition, and epidemic (ICE) model dynamics. The information layer follows a Daley-Kendall (Daley & Kendall, 1964) rumour-spreading model with higher-order (group) interactions where individuals can be in one of four states: the uninformed (U), the gossip spreader (G), the aware stifler (A), and the corrected (C). Transitions between information states are depicted in the top layer. In the cognition layer, individuals can alternate between states that are non-protected (N) and protected (P) against infection with transition rates ζN→P and ζP→N, depending on the proportion of gossip spreaders and the perceived level of protection in their neighbourhood. In the epidemic layer, disease transmission occurs as a result of pairwise interactions between susceptible (S) and infectious (I) individuals at a rate βXY, X,Y ∈ (N,P), which is influenced by the cognitive state of the interacting peers. Infected individuals recover (R) at a rate μ. The pairwise networks were constructed and visualised using the Python library ‘NetworkX’ (HagbergSchultSwart, August 2008).
Fig. 2
Fig. 2
(A) The hyper-edge structure of the information layer is based on the bipartite configuration model (Battiston et al., 2020). This configuration includes a degree sequence, represented by the corresponding number of stubs (half-edges) associated with each node (circles in panel A), and a sequence of hyper-edge sizes, represented by the corresponding stubs associated with each hyper-edge (squares). The number of stubs in both nodes and hyper-edges must be equal. Furthermore, the stubs are connected in a bipartite format through random pairing. The resulting network was constructed and visualised using the Python library ‘HyperNetX’ (Pacific Northwest National Laboratory). (B) A schematic diagram of the hyper-edge threshold rumour diffusion process. A spreader node (blue) is randomly selected based on the degree distribution. Then, a random hyper-edge containing the spreader node is chosen. Every ignorant (orange) individual in the chosen hyper-edge becomes a spreader if the proportion of spreaders (red) in the hyper-edge exceeds the corresponding threshold.
Fig. 3
Fig. 3
Reproduction numbers and the proportion of susceptible individuals who are unprotected as a function of changes in behavioural parameters under the homogeneous mixing assumption. Panels (A) and (B) have the same density of gossip spreaders ρG = 0.1, the same level of information-based protection removal rate ζ1 = 0.5, with fixed values of ζ4 = 0.4 and ζ3 = 0.4. In Panel (C), removal and adoption rates of neighbourhood-based protection are set to ζ3 = 0.2 and ζ4 = 0.4, and the density of gossip spreaders is ρG = 0.25. Other parameters are provided in Table 2.
Fig. 4
Fig. 4
Stifler density with either a pairwise or hyper-edge misinformation spreading structure when a single rumour vanishes due to the stifling process without correction interventions. The degree exponent is γi = 2.5, representing a scale-free network. A single rumour (ω = 0) and no correction (σ = 0) are considered, with λ ∈ [0, 5] and a stifling rate of α = 1. Other parameters are provided in Table 2.
Fig. 5
Fig. 5
The trajectory of gossip spreaders, stiflers, and corrected individuals over time for different values of ω. Other parameters are provided in Table 2, with λ = 1/3, α = 1/3, ζ1 = ζ2 = 0.2, and ζ3 = ζ4 = 0. The scenarios correspond to a single rumour (ω = 0), a new rumour every 5 days (ω = 0.2), and a new rumour every 2 days (ω = 0.5).
Fig. 6
Fig. 6
Attack rate as a function of the rates of adopting protective measures based on information or neighbourhood behaviour in (A) a heterogeneous network and (B) a homogeneous network representing the epidemic layer, with ⟨k⟩ = 4.5 and βNN = 0.228. Other parameters are given in Table 2, including the misinformation spreading rate of λ = 1/3, stifling rate of α = 1/3, gossip interest renewal rate of ω = 1/5, and correction rate of σ = 0. The rates of withdrawal from protective behaviours are ζ1 = 0.2 in the information layer and ζ3 = 0 in the cognition layer. Each data point on the heatmaps is the average of 100 independent realisations.
Fig. 7
Fig. 7
Attack rate as a function of information-based and neighbourhood-based protective behaviour adoption rates. In panel (A), a power-law network with βNN = 0.228 for the epidemic layer corresponds to the homogeneous network shown in Fig. 6, with R0 = 5.7. In panel (B), a power-law network is used with a higher transmission rate βNN = 0.4, with R0 = 10. Other parameters are provided in Table 2, with the misinformation spreading rate of λ = 1/3, stifling rate of α = 1/3, gossip interest renewal rate of ω = 1/5, correction rate of σ = 0, and withdrawal rates of ζ1 = 0.2 and ζ3 = 0 for protective behaviours. Each data point on the heatmaps is the average of 100 independent realisations.
Fig. 8
Fig. 8
Attack rate as a function of the renewal interest rate (ω) and the misinformation correction rate (σ). Other parameters are provided in Table 2, with a misinformation spreading rate of λ = 1/3, and a stifling rate of α = 1/3. The rate of withdrawing from protective behaviours in the cognition layer is ζ1 = 0.2, and the rate of adopting protective behaviours is ζ2 = 0.2. Each data point on the heatmap is the average of 100 independent realisations.
Fig. 9
Fig. 9
Attack rate as a function of the renewal interest rate (ω) and correction rate of misinformation (σ) with two types of correction strategies: (A) suspension of individuals from the information network, and (B) warning and/or educating individuals within the information network. The relapse rate in (A) and (B) is set to ϕ = 0.2. Fixing ω = 1.4, panels (C) and (D) show the attack rate as a function of the relapse rate (ϕ) and the correction rate (σ) for the two correction strategies, respectively. In all scenarios, the spreading rate of misinformation is λ = 1/3, the stifling rate is α = 1/3, the rate of withdrawing from protective behaviours in the cognition layer is ζ1 = 0.2, and the rate of adopting protective behaviours is ζ2 = 0.2. Other parameters are provided in Table 2. Each data point on the heatmaps is the average of 100 independent realisations.

Similar articles

References

    1. Askarizadeh M., Ladani B.T., Hossein Manshaei M. An evolutionary game model for analysis of rumor propagation and control in social networks. Physica A: Statistical Mechanics and its Applications. 2019;523:21–39. doi: 10.1016/j.physa.2019.01.147. - DOI
    1. Bansal S., Grenfell B.T., Meyers L.A. When individual behaviour matters: Homogeneous and network models in epidemiology. Journal of the Royal Society, Interface. 2007;4(16):879–891. doi: 10.1098/rsif.2007.1100. - DOI - PMC - PubMed
    1. Barabási A.-L. Cambridge University Press Cambridge; 2016. Network science.
    1. Battiston F., Cencetti G., Iacopini I., Latora V., Lucas M., Patania A., Young J.-G., Petri G. Networks beyond pairwise interactions: Structure and dynamics. Physics Reports. 2020;874:1–92. doi: 10.1016/j.physrep.2020.05.004. - DOI
    1. Bertotti M.L., Modanese G. The configuration model for barabasi-albert networks. Applied Network Science. 2019;4(1):1–13. doi: 10.1007/s41109-019-0152-1. - DOI

LinkOut - more resources