

Efficacy and safety of varenicline and bupropion, in combination and alone, for alcohol use disorder: a randomized, double-blind, placebo-controlled multicentre trial
- PMID: 40487775
- PMCID: PMC12142338
- DOI: 10.1016/j.lanepe.2025.101310
Efficacy and safety of varenicline and bupropion, in combination and alone, for alcohol use disorder: a randomized, double-blind, placebo-controlled multicentre trial
Abstract
Background: Alcohol use disorder (AUD) is associated with an enormous burden of disease and cost to society. The dopamine deficiency hypothesis posits that negative reinforcement generated by a low brain dopamine state drives ethanol intake. Here, we evaluated the efficacy and safety of combined administration of two dopamine-enhancing drugs, varenicline (a partial nicotinic acetylcholine receptor agonist) and bupropion (a weak dopamine-reuptake inhibitor) on alcohol intake in AUD.
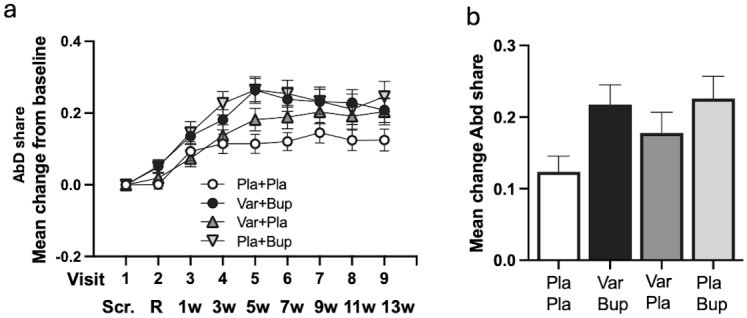
Methods: Participants aged 25-70 years with moderate-to-severe AUD (defined as ≥4/11 Diagnostic and Statistical Manual of Mental Disorders [DSM]-5 criteria) were enrolled in this randomized, double-blind, placebo-controlled trial, done at four outpatient clinics in Sweden. Participants were randomly assigned (block size 8) 1:1:1:1 to Placebo + Placebo, Varenicline + Bupropion, Varenicline + Placebo, or Placebo + Bupropion. After a 1-week titration period, Varenicline was taken as 1 mg orally twice per day and bupropion as 150 mg orally twice per day for 12 weeks. Participants, investigators, and all study personnel were unaware of treatment allocation. The two primary outcomes were phosphatidylethanol in blood (B-PEth) and self-reported percentage heavy drinking days (%HDD), assessed over a steady state 10-week-period (from start of week 2 to end of week 11). Modified intention-to-treat (mITT) and per protocol analyses (PP) were performed using a sequential hierarchical statistical method. This registered study (EudraCT 2018-000048-24; clinicaltrials.govNCT04167306) is completed.
Findings: Between March 4, 2019, and December 14, 2022, 384 participants were randomly assigned: Placebo + Placebo = 97, Varenicline + Bupropion = 100, Varenicline + Placebo = 96, Placebo + Bupropion = 91. 72% participants were male (277/384) and 28% female (107/384), median age 57 (13) years. In the mITT analyses, Varenicline + Bupropion reduced B-PEth (Cohen's d [d] = 0·39, p = 0·004) and %HDD (d = 0·31, p = 0·008) vs Placebo + Placebo. Varenicline + Placebo also reduced B-PEth (d = 0·30, p = 0·005) and %HDD (d = 0·36, p = 0·023) vs Placebo + Placebo. For both primary endpoints, differences between the Varenicline + Bupropion and Varenicline + Placebo groups were not statistically significant (B-PEth: d = 0·022, p = 0·97, %HDD: d = 0·027, p = 0·76), precluding further comparisons according to the statistical hierarchy. In PP analyses, both primary outcomes were reduced with Varenicline + Bupropion (d = 0·43 [B-PEth]; d = 0·41 [%HDD]) and Varenicline + Placebo (d = 0·29 [B-PEth]; d = 0·34 [%HDD]) compared with Placebo + Placebo. Nausea, the only safety concern, was more common in the Varenicline + Placebo group than in the Placebo + Placebo group (49/96 vs 11/97, p < 0·0001) and of longer median duration (45 (70) vs 10 (14·5) days, p = 0·001). Nausea incidence was lower in the Varenicline + Bupropion group vs Varenicline + Placebo (36/100 vs 49/96, p = 0·048) and of shorter median duration (16·5 (39·3) vs 45 (70) days, p = 0·010).
Interpretation: Two brain dopamine elevating treatments (Varenicline + Bupropion; Varenicline + Placebo) reduce alcohol consumption compared with placebo alone. Effect sizes were largest when Varenicline and Bupropion were combined and compliance was high (PP-population). Bupropion reduced Varenicline-induced nausea. Varenicline + Bupropion or other mild dopamine enhancers should be further explored for treatment of AUD.
Funding: This study was funded primarily by the Swedish Research Council.
Keywords: AUD; Bupropion; Combination treatment; RCT; Varenicline.
© 2025 The Author(s).
Conflict of interest statement
Andrea de Bejczy and Bo Söderpalm are the founders and co-owners of Sobrera Pharma AB. Helga Lidö, Barbro Askerup, and Cecilia Nilsson-Wallmark are co-owners of Sobrera Pharma AB. Bo Söderpalm has received honoraria for lectures from Lundbeck, Takeda, and Evolan. Markus Heilig has received research funding or consulting fees in the past 5 years from Aelis Farma, Brainsway Technologies, Camurus, Indivior, Janssen, Molteni, Nordic Drugs, and Pfizer. Daniel Lindqvist has received research grants from Biogaia AB and honoraria for lectures from Janssen-Cilag AB and H. Lundbeck AB. Johan Franck, Anders Håkansson, Joar Guterstam and Markus Samuelson report no conflicts of interest. This study is an academic study and all decisions concerning the design, execution, analysis, and publications have been and are made by the academic research group/sponsor team with PI/sponsor Bo Söderpalm. Sobrera Pharma has not produced or supplied any of the study drugs or had any involvement in the statistical analysis or data interpretation.
Figures


References
-
- WHO Global status report on alcohol and health. 2018. https://www.who.int/publications/i/item/9789241565639
-
- Ramboll Management Consulting AB . 2020. The socioeconomic consequences of alcohol. A descriptive socioeconomic study.https://www.omsystembolaget.se/globalassets/pdf/alkoholproblematik/rambo... Swedish. 2019.
-
- Nutt D.J., Rehm J. Doing it by numbers: a simple approach to reducing the harms of alcohol. J Psychopharmacol. 2014;28:3–7. - PubMed
-
- Heather N., Adamson S.J., Raistrick D., Slegg G.P., Team U.R. Initial preference for drinking goal in the treatment of alcohol problems: I. Baseline differences between abstinence and non-abstinence groups. Alcohol Alcohol. 2010;45:128–135. - PubMed
Associated data
LinkOut - more resources
Full Text Sources
Medical
Miscellaneous
