. 2025 May 20;10(21):22085-22098.
doi: 10.1021/acsomega.5c02248. eCollection 2025 Jun 3.

Exploration of Crucial miRNA Signatures and Molecular Mechanisms in the System of Muscle-Exosome-Bone: Evidence from Transcriptome Data

Affiliations

Exploration of Crucial miRNA Signatures and Molecular Mechanisms in the System of Muscle-Exosome-Bone: Evidence from Transcriptome Data

Bin Wang et al. ACS Omega. .

Abstract

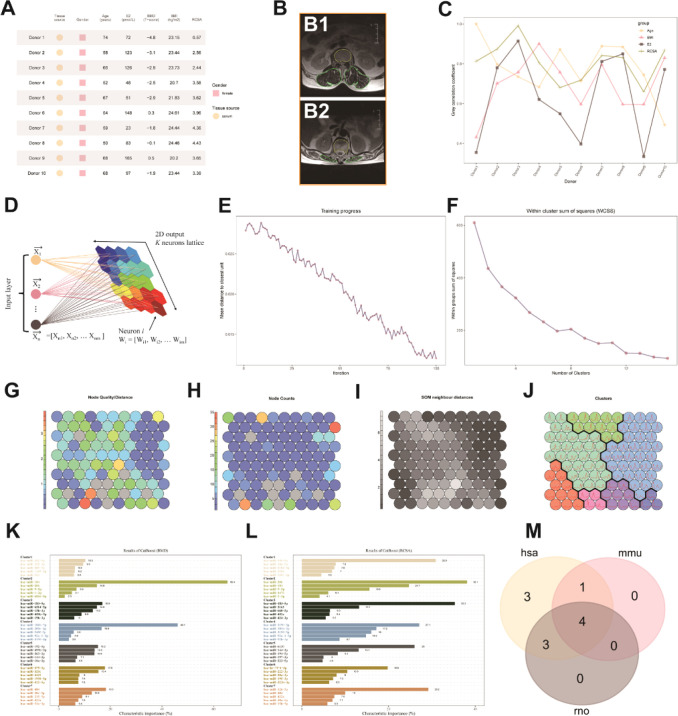
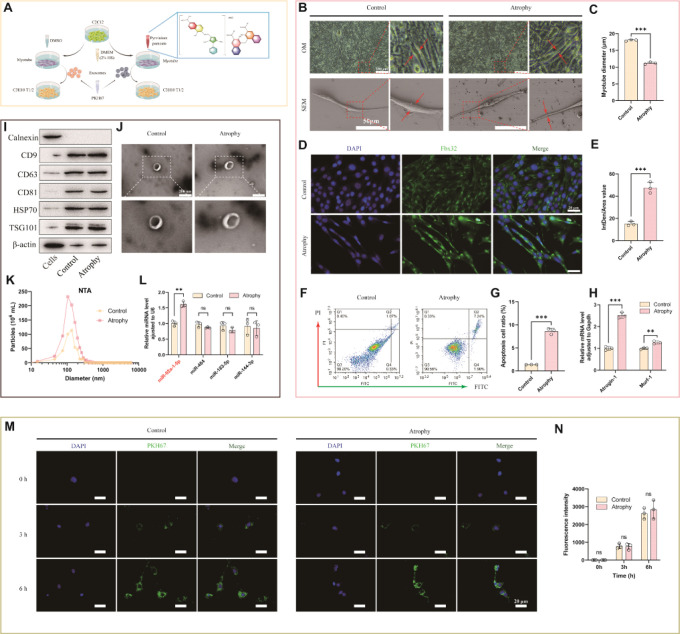
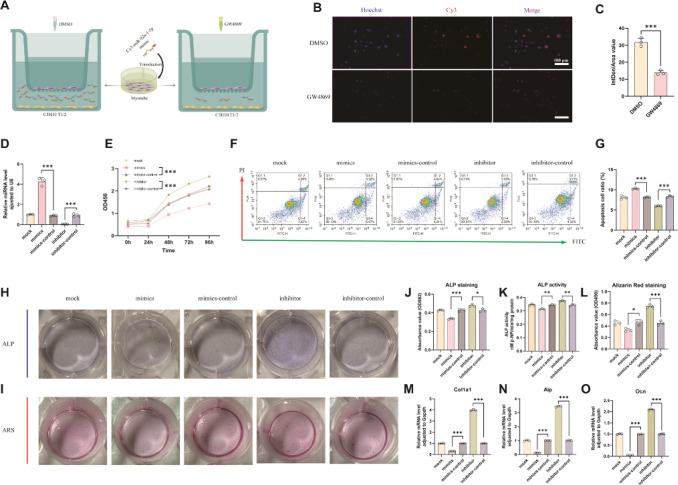
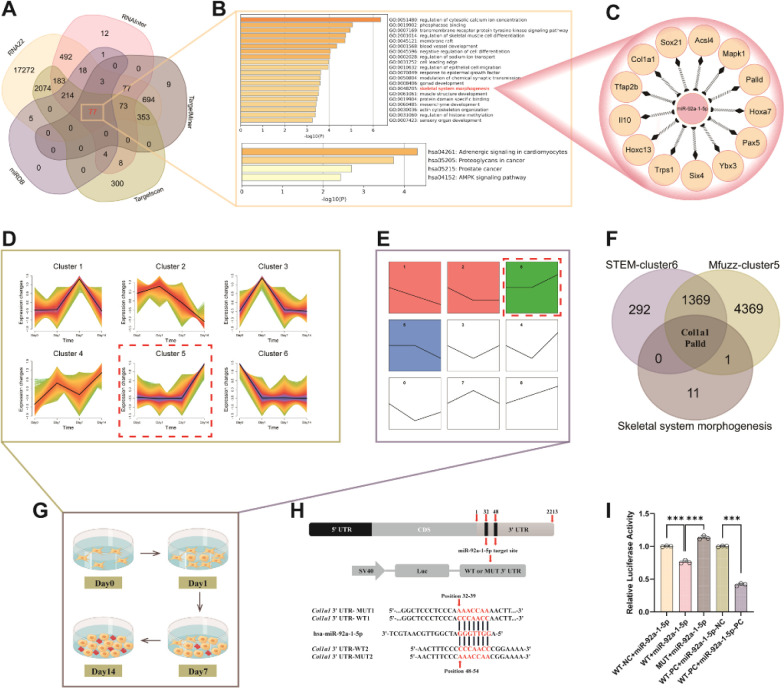
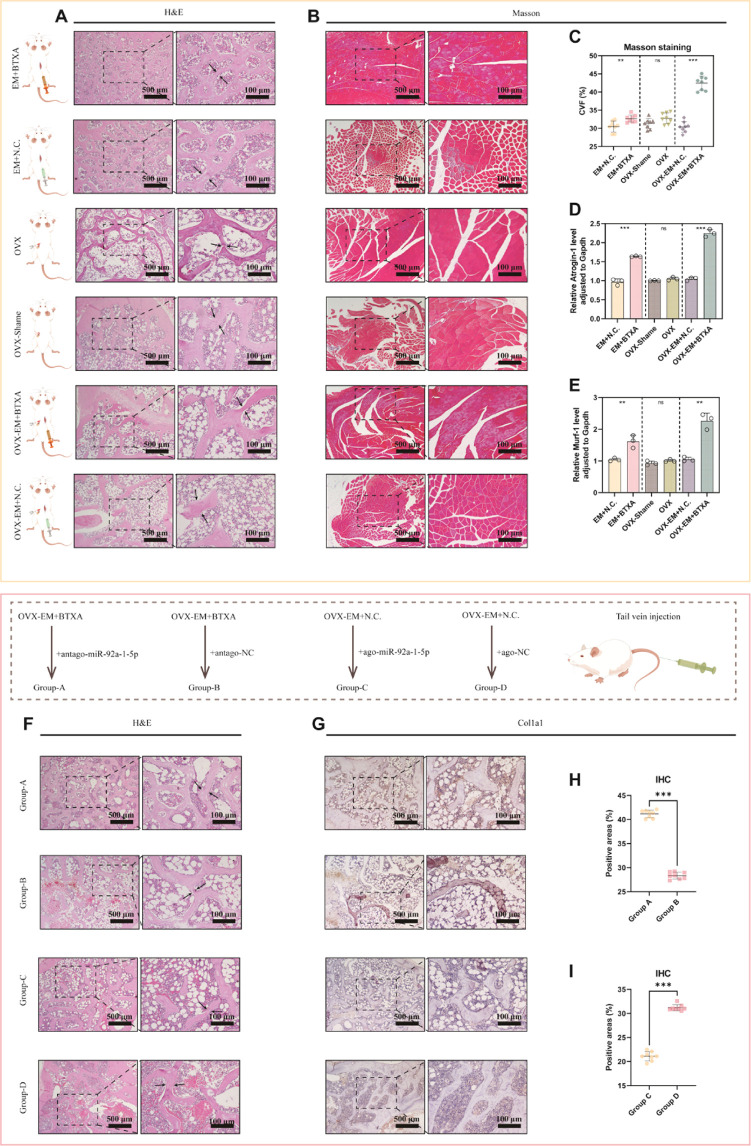
Muscles and bones are adjacent in spatial position and closely related in function. Exosomes can achieve communication between donor and receptor cells by carrying molecules, such as miRNAs. Therefore, the purpose of this study is to use exosome-miRNA as a bridge, explore the correlation between clinical manifestations, and use bioinformatics and machine learning to cluster and screen exosome-miRNA sequencing data. In vitro and in vivo experiments were conducted to validate the screened molecules. Three parts were explored to identify miRNAs that play a key regulatory role in the muscle-exosome-bone system. Ultimately, it was found that miR-92a-1-5p may play a crucial role in this system; that is, atrophic muscle cells can inhibit osteogenic differentiation by releasing exosomes carrying miR-92a-1-5p into osteoblasts and targeting Col1a1.


Figures

1
1
Screening crucial miRNAs associated with muscle and bone phenotype simultaneously based on clinical and sequencing data. (A) Demographic data of donors included in the study. (B) The MRI image of two typical donors (B1) has a higher RCSA than (B2). (C) GRA was used to analyze the relation among age, BMI, E2, and RCSA with the BMD. (D–J) Reduce dimensionality and cluster exosome miRNA data matrix using SOM: (D) schematic diagram of SOM; (E) training progress showed whether the number of iterations is enough; (F) to select the appropriate number of clusters through the rockfall map further; (G) the introversion and quality of SOM center node; (H) the number of genes included in the SOM center node; (I) proximity distance of SOM center node; (J) classified SOM clusters. (K–M), Screening for species conserved miRNAs associated with both BMD and RCSA by CatBoost simultaneously: (K) the top 5 miRNAs among different clusters based on the high and low BMD grouping; (L) the top 5 miRNAs among different clusters based on the high and low RCSA grouping; (M) candidate miRNAs with interspecific conservation that intersect the top 5 feature values in both BMD and RCSA phenotypes within the same cluster.
2
2
Screening and validation of candidate miRNAs through experiments. (A), Schematic diagram of the experiment (graphic created using Figdraw). (B–H) Establishment of muscle atrophy cell model: (B) morphology of muscle fibers in the control and atrophy groups under OM and SEM; (C) comparison of myotube diameter between the control and atrophy groups under OM; (D) using IF technology to detect the expression levels of FBX32 in the cytoplasm of the control and atrophy groups; (E) comparison of average fluorescence intensity of IF detection between the control and atrophy groups; (F) flow cytometry scatter plots; and (G) comparison of cell apoptosis rates between the control and the atrophy groups; (H) after constructing the cell model, real-time PCR technology was used to detect the content of Atrogin-1 and Murf-1 in the cells. The average expression of mRNA in the control group was standardized with Gapdh as the internal reference (n = 3). (I–L), Identification of exosomes in the supernatant of cell models and screening of candidate miRNAs through real-time PCR: (I) WB detection of protein expression of exosomes characteristic membrane proteins in control group, atrophy group, and cells (J) TEM was used to detect the morphology of exosomes in the control group and the atrophy group; (K) NTA detection of exosomes particle size in the control group and atrophy groups; (L) real-time PCR technology was used to detect the expression levels of exosomes candidate miRNAs in the control group and atrophy group, standardize the mean miRNA expression in the control group, and use U6 as the internal reference (n = 3). (M,N) PKH67 marked exosomes are ingested by recipient cells: (M) fluorescence intensity of exosomes in the control group and atrophy groups at 0, 3, and 6 h after the addition to receptor cells; (N) the fluorescence expression levels at 0, 3, and 6 h after the addition of exosomes to receptor cells in the control group and atrophy groups. ns = No statistical significance, *p < 0.05, **p < 0.01, ***p < 0.001.
3
3
The effect of C2C12-derived exosomal miRNA on osteogenic differentiation of C3H10 T1/2 cells. (A), Schematic diagram of the experiment (graphic created using Figdraw). (B,C) miR-92a-1-5p can enter receptor cells through the exosome pathway: (B) fluorescence expression levels of DMSO and GW4869 groups in receptor cells and (C) average fluorescence intensity between two groups in receptor cells. (D) Real-time PCR technology was used to detect the expression levels of miR-92a-1-5p after transfection into recipient cells, standardize the mean miRNA expression in the DMSO group, and use U6 as the internal reference (n = 3). (E–O) The effects of miR-92a-1-5p transfection into recipient cells on cell proliferation, apoptosis, and osteogenic ability: (E) CCK-8 assay was applied to measure the cell proliferation at 0, 24, 48, 72, and 96 h; (F) flow cytometry scatter plots and (G) comparison of cell apoptosis rates among 5 groups; (H) the ALP staining result under the light microscope at 7 days; (I) the ARS staining result under the light microscope at 14 days; (J) the quantify analysis result of ALP; (K) the ALP activity result; (L) the quantify analysis result of ARS. (M–O) After transfection, real-time PCR technology was used to detect the content of Col1a1, Alp, and Ocn in the cells. The average expression of mRNA in the mock group was standardized with Gapdh as the internal reference (n = 3). ns = No statistical significance, *p < 0.05, **p < 0.01, ***p < 0.001.
4
4
Prediction and validation of miR-92a-1-5p target genes. (A,) Venn plot for predicting miR-92a-1-5p target genes. (B), GO and KEGG enrichment analyses of target gene functions and pathways. (C) The genes in the pathway of skeleton system morphogenesis. (D,E) Gene modules related to osteogenic induction in C3H10 T1/2 cells through bioinformatics analysis: (D) Mfuzz and (E) STEM time series analysis were used to analyze the sequencing data at different time points in osteogenic differentiation. (F) Intersecting genes among the characteristic cluster of Mfuzz, STEM analysis, and skeletal system morphogenesis genes. (G) Schematic diagram of bone induction at different time points (graphic created using Figdraw). (H) Prediction of binding sites between miR-92a-1-5p and Col1a1. (I) Verification of binding sites by dual luciferase assay. ns = No statistical significance, *p < 0.05, **p < 0.01, ***p < 0.001.
5
5
Establishment of animal models and validation of miR-92a-1-5p and Col1a1 in vivo experiments (graphics in the schematic section using Figdraw). (A) H&E staining of vertebrae in different animal models. (B–E) Verification of the degree of erector spinae muscle atrophy in different animal models: (B) Masson staining of erector spinae muscle in different animal models; (C) comparison of CVF(%) among different animal models; (D) after constructing the animal model, and real-time PCR technology was used to detect the content of Atrogin-1 and Murf-1. (E) The average expression of mRNA in the control group was standardized with Gapdh as the internal reference (n = 3). (F–I) In vivo experimental verification of the effect of miR-92a-1-5p on osteogenic function: (F) H&E staining of different groups of vertebrae after tail vein injection and (G) the COL1A1 IHC among different groups of vertebrae after tail vein injection (H). The quantitative analysis between Groups A and B. (I) The quantitative analysis between Groups C and D. ns = No statistical significance, *p < 0.05, **p < 0.01, ***p < 0.001.

Similar articles

References

    1. Melton L. J. 111, Chrischilles E. A., Cooper C., Lane A. W., Riggs B. L.. Perspective How many women have osteoporosis? J. Bone Miner. Res. 1992;7(9):1005–1010. doi: 10.1002/jbmr.5650070902. - DOI - PubMed
    1. Aloia J. F., McGowan D. M., Vaswani A. N., Ross P., Cohn S. H.. Relationship of menopause to skeletal and muscle mass. Am. J. Clin. Nutr. 1991;53(6):1378–1383. doi: 10.1093/ajcn/53.6.1378. - DOI - PubMed
    1. Jubrias S. A., Odderson I. R., Esselman P. C., Conley K. E.. Decline in isokinetic force with age: M uscle cross-sectional area and specific force. Pflugers Arch. 1997;434(3):246–253. doi: 10.1007/s004240050392. - DOI - PubMed
    1. Signorelli S. S., Neri S., Sciacchitano S., Pino L. D., Costa M. P., Marchese G., Celotta G., Cassibba N., Pennisi G., Caschetto S.. Behaviour of some indicators of oxidative stress in postmenopausal and fertile women. Maturitas. 2006;53(1):77–82. doi: 10.1016/j.maturitas.2005.03.001. - DOI - PubMed
    1. Rolland Y. M., Perry H. M. 3rd, Patrick P., Banks W. A., Morley J. E.. Loss of appendicular muscle mass and loss of muscle strength in young postmenopausal women. J. Gerontol., Ser. A. 2007;62(3):330–335. doi: 10.1093/gerona/62.3.330. - DOI - PubMed

LinkOut - more resources