. 2025 Jun 6;7(3):fcaf192.
doi: 10.1093/braincomms/fcaf192. eCollection 2025.

Encephalography cross-frequency coupling and brain alteration in amyotrophic lateral sclerosis

Affiliations

Encephalography cross-frequency coupling and brain alteration in amyotrophic lateral sclerosis

Cristina Benetton et al. Brain Commun. .

Abstract

The diagnosis of amyotrophic lateral sclerosis requires identifying degeneration in both brain and bulbospinal motor neurons. However, detecting cortical dysfunction remains challenging, as peripheral symptoms often overshadow upper motor neuron signs. Although transcranial magnetic stimulation and MRI are valuable tools, transcranial magnetic stimulation is challenged as disease progresses but also at early stage in some patients, and brain MRI shows in most cohorts no significant change at the time of diagnosis. This emphasizes the need for neuromarkers facilitating detection of cortical dysfunction and longitudinal monitoring. EEG offers promising avenues. Accordingly, we recently identified altered theta-gamma phase-amplitude coupling in amyotrophic lateral sclerosis. The present study aimed to further explore phase-amplitude coupling in patients, focusing not only on theta and gamma bands but also on alpha and beta bands, and the link with handedness and brain structure. Resting-state EEG was recorded in 26 patients with amyotrophic lateral sclerosis and 26 age- and sex-matched controls, alongside anatomical and diffusion MRI. PAC was calculated between slow and gamma oscillations at five sensorimotor electrodes bilaterally. Grey and white matter integrity was evaluated through cortical thickness measurements and diffusion metrics along the corticospinal tract. Results revealed significantly decreased theta-gamma PAC in the dominant hemisphere of patients, without changes in band powers or other frequency couplings. MRI confirmed well-known handedness-related brain structural asymmetry in both groups, although it was less pronounced in patients. Specifically, diffusion metrics were altered in the most caudal segment (brainstem level) of the pyramidal tract within the dominant hemisphere in patients. These findings align with lateralized theta-gamma PAC alterations and the greater vulnerability of the dominant hemisphere to amyotrophic lateral sclerosis. No correlation was found between electrophysiological and diffusion metrics, likely because they are related to different mechanisms: PAC alteration being presumably linked to excitation/inhibition imbalance preceding upper motor neuron degeneration. Moreover, theta-gamma PAC was found to be particularly altered in patients with altered cognitive scores, consistent with previous findings in patients with mild cognitive impairment. Lastly, receiver operating characteristic analyses demonstrated that PAC outperformed diffusion MRI in diagnostic accuracy, underscoring its potential as a very sensitive marker of cortical dysfunction in amyotrophic lateral sclerosis. Although these results need validation in a larger cohort at different stages of the disease and across different forms (sporadic and familial), they confirm that PAC can detect cortical dysfunctions in amyotrophic lateral sclerosis.

Keywords: EEG; MRI; cerebral atrophy; cortical excitability; phase amplitude coupling.


Conflict of interest statement

The authors report no competing interests.

Figures

Graphical Abstract
Graphical Abstract
Figure 1
Figure 1
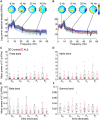
Power spectral analysis. (A and B) Topography of the signal power at 6 (within the theta band), 10 (within the alpha band), 22 (within the beta band) and 45 Hz (within the gamma band) in one healthy control (A) and one patient with amyotrophic lateral sclerosis (ALS) (B). The XY plot below represent the log10 power (dB/Hz) plotted against the frequency (Hz) for all the 74 channels of the EEG cap. The colour scale is adjusted for each topographical map individually so as to span the entire range of the signal shown with black bars on the spectrum. (C-F) Box plots representing the distribution of the mean power in theta (C), alpha (D), beta (E) and gamma bands (F) at the level of electrodes over the primary sensorimotor areas corresponding to C3 and C4 electrodes, recoded according to the handedness-related dominant (Cd) and non-dominant hemisphere (Cn), Cz, Fz and Pz (according to the EEG 10–20 international montage). The central box represents the interquartile range (IQR). The bottom and top edges of the box correspond to the first quartile (Q1) and third quartile (Q3), respectively. The line inside the box represents the median (Q2). The lines extending from the top and bottom of the box (whiskers) represent the range of the data outside the IQR (1.5×IQR from Q1 and Q3). Each point represents data from an individual (controls in black and patients with ALS in red), with points outliers appearing outside the whiskers’ limits. N = 26 controls and 26 patients with ALS. Linear mixed model: Group (Controls versus ALS), F(1,48.95) = 0.0199, P = 0.88.
Figure 2
Figure 2
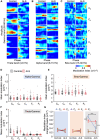
PAC between frequency pairs in handedness-related dominant and non-dominant sensorimotor cortex. (A–C) Phase–amplitude comodulogram computed from EEG data in one control (left columns) and one patient with amyotrophic lateral sclerosis (ALS; right columns), illustrating cross-frequency coupling interactions between low-frequency phase (theta in A, alpha in B and beta in C) and high-frequency amplitude (gamma) oscillations. The heatmap shows the coupling strength, where higher values (in red) indicate strong modulation of high-frequency amplitude by low-frequency phase. (D-F) Box plots as in Fig. 1, representing the distribution of the mean modulation index of phase–amplitude (PAC) between alpha-gamma (D), beta-gamma (E) and theta-gamma bands (F), in controls (black) and ALS (red) at the level of the five electrodes of interest; C3 and C4 electrodes being recoded according to the handedness-related dominant (Cd) and non-dominant (Cn) hemispheres. (G) Marginal means estimated from a repeated measure linear mixed model which, provide the average predicted values of the alpha-gamma (blue zone), the beta-gamma (orange zone) and the theta-gamma (grey zone) PAC modulation index in controls and patients with ALS, at the level of Cd (blue dots and lines), Cn (red dots and lines), Cz (purple dots and lines), Fz (brown dots and lines) and Pz (dark orange dots and lines). Error bars indicate the standard errors of the estimates. N = 26 controls and 26 patients with ALS. Repeated measure linear mixed model: Group (Controls versus ALS), F(1, 51.07) = 4.4071, P < 0.05. *** P < 0.0001 after post hoc comparisons.
Figure 3
Figure 3
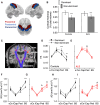
Structural brain changes. (A) Cortical thickness was measured in the precentral (red), postcentral (blue), and paracentral regions (dark blue), which correspond to areas covered by the Cn and Cd electrodes (images extracted from one control). (B) The grey matter volume in each region was normalized to the total intracranial volume of each individual. The bars represent the mean normalized volumes in the three regions of interest (±1 standard error) for the dominant (white bars) and non-dominant hemispheres (grey bars) in controls (left) and patients with amyotrophic lateral sclerosis (ALS; right). Repeated measure linear mixed model: Brain hemispheres (dominant versus non-dominant), F(1,50) = 66.8358, P < 0.0001. (C) Tractography of the right and left corticospinal tract in one patient with ALS overlaid on a T1-weighted MRI coronal view. Diffusion metrics were calculated near the cerebral cortex (sub-cortex, s.Cortex), at the level of the internal capsule (i.Capsule), the cerebral peduncles (Peduncle) and the brainstem (Brainstem). (D and E) Mean fractional anisotropy (FA; ±1 standard error) for the dominant (filled circles, solid lines) and non-dominant corticospinal tracts (triangles; dashed lines) for the control group (black, D) and the ALS group (red, E) across the four levels of interest (s.Cx: sub-cortex level, i.Cap: internal capsule, Ped: cerebral peduncles, and BS: brainstem). (F and G) Mean radial diffusivity (RD, mm2/s × 10−3) for the control group (F) and ALS group (G), same legend as in DE. (H and I) Mean axial diffusivity (AD, mm2/s × 10−3) for the control group (H) and ALS group (I), same legend as in D and E. Repeated measure linear mixed model: Brain hemispheres (dominant versus non-dominant): (i) FA: F(1,42.12) = 12.6165, P < 0.001, (ii) RD: F(1,47.26) = 8.8697, P < 0.01 and (iii) Ad: F(1,47.24) = 1.053, P = 0.31. N = 26 controls and 26 patients with ALS. *P < 0.05, **P < 0.001, ***P < 0.0001 after post hoc comparisons.
Figure 4
Figure 4
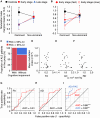
Links with clinical phenotype. (A and B) Marginal means of the theta-gamma PAC modulation index in controls (black) and patients at different disease stages: early stage (≤1 year after disease onset, red) and later stage (>1 year after the first symptom, blue; A). Data are presented separately for the dominant hemisphere (left side of the panel) and the non-dominant hemisphere (right side of the panel). Patients in the early stage were further divided into two groups based on their mean progression rate: fast progressors (filled diamonds) versus low progressors (open diamonds; B). (C) Contingency table illustrating the proportion of patients with amyotrophic lateral sclerosis (ALS), with (left part) or without (right part) cognitive impairment according to their ECAS total score and whether their mean modulation index of theta-gamma PAC on the dominant hemisphere was within the limits of (inblue) or strictly inferior to (< in red) to the lower limit of the 95% confidence interval of theta-gamma PAC modulation index in the control group. (D–F) Mean modulation index of theta-gamma PAC on the dominant hemisphere in patients with ALS plotted against the fractional anisotropy (FA, D), axial diffusivity (AD, E) and radial diffusivity (RD, F) of the dominant-side corticospinal tract at the brainstem level. (G–I) Receiver operating characteristic (ROC) curve illustrating the diagnostic ability of FA (G), AD (H), and PAC alone (in red) or combined with AD (in blue, I). The y-axis represents the true positive rate (sensitivity), while the x-axis represents the false positive rate (1—specificity). The diagonal black line represents a model with no discriminative power (random guessing). The area under the curve (AUC) quantifies the overall ability of the model to correctly classify positive and negative cases, where an AUC value closer to 1 indicates better performance. N = 24 patients with ALS. Linear mixed model: Group (Controls versus ALS), F(2,48) = 5.9964, P < 0.01. ROC analysis for combined PAC and AD, Chi2 = 28.49 for PAC (P < 0.0001) and 8.73 for AD (P < 0.01). *P < 0.05, ** P < 0.001.

Similar articles

References

    1. Kiernan MC, Vucic S, Cheah BC, et al. Amyotrophic lateral sclerosis. Lancet. 2011;377(9769):942–955. - PubMed
    1. Shefner JM, Al-Chalabi A, Baker MR, et al. A proposal for new diagnostic criteria for ALS. Clin Neurophysiol. 2020;131(8):1975–1978. - PubMed
    1. Turner MR, Talbot K. Mimics and chameleons in motor neurone disease. Pract Neurol. 2013;13(3):153–164. - PMC - PubMed
    1. Cellura E, Spataro R, Taiello AC, La Bella V. Factors affecting the diagnostic delay in amyotrophic lateral sclerosis. Clin Neurol Neurosurg. 2012;114(6):550–554. - PubMed
    1. Gwathmey KG, Corcia P, McDermott CJ, et al. Diagnostic delay in amyotrophic lateral sclerosis. Eur J Neurol. 2023;30(9):2595–2601. - PubMed

LinkOut - more resources