. 2025 Jun 6;53(11):gkaf460.
doi: 10.1093/nar/gkaf460.

Deciphering meiotic chromatin organization by SYCP3

Affiliations

Deciphering meiotic chromatin organization by SYCP3

Shimeng Guo et al. Nucleic Acids Res. .

Abstract

Chromatin structure during meiosis is different from somatic cells due to the assembly of the synaptonemal complex between homologous chromosome axes. However, genome-wide organizing principles of this meiosis-specific multiprotein complex remain mysterious despite intensive super-resolution imaging analysis. Here, we profiled chromatin occupancy of SYCP3, the key chromatin organizer of synaptonemal complex, in mouse spermatocytes, and showed its enrichment at open chromatin regions. Moreover, SYCP3 occupancy was largely inherited from the leptotene to pachytene stage, facilitated by transcription and fibrous assembly, and was enriched at specific SINE repeats. We also identified SYCP1-occupied regions mainly as a subpopulation of SYCP3-occupied regions with high cohesin enrichment. Collectively, our results demonstrate genome-wide profiling of SYCP3 in mouse meiosis and reveal that its occupancy is a dynamic process modulated by chromatin-related events.


Conflict of interest statement

None declared.

Figures

Graphical Abstract
Graphical Abstract
Figure 1.
Figure 1.
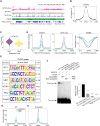
SYCP3 occupancy in meiotic chromatin identified by modified CUT&Tag. (A) Integrative Genomics Viewer (IGV) genome browser snapshots of SYCP3 occupancy in pachytene spermatocytes with IgG as negative control, ATAC-seq of spermatocytes, and WGBS signals of spermatocytes. (B) Density plot of GC content around the peak center of SYCP3 (±2 kb) in pachytene spermatocytes. Each dot represents mean GC content using a 100 bp-wide rolling window. (C) Violin plots of log2(normalized counts) of SYCP3 enrichment in hypomethylation and hypermethylation regions in spermatocytes. P value was calculated by the Wilcoxon rank-sum test. (D) Read density plots of the distribution of SYCP3 peaks, ATAC-seq, and WGBS signals at high/intermediate/low SYCP3 occupancy regions (center ± 2.0 kb) in spermatocytes. (E) Putative motifs strongly enriched in SYCP3-binding sequences in pachytene spermatocytes. (F) EMSA assay showing the binding activity of recombinant SYCP3 protein to the double-stranded DNA (dsDNA) probe. 0.2 μM biotin-labeled probe and 1 μg of SYCP3 protein were added per reaction. Probe sequence was selected based on positive SYCP3 signal at meiotic chromatin in mouse spermatocytes. Mutated (Mut) sequence was obtained through G/C-to-A/T and A/T-to-G/C substitution of WT sequence. Probe/competitor sequence, forward: 5′-ACAGTCCTGGTGATTGAACTCCGGCCCTGGGCATGCCAGGCGAGCACTCCACTCTTTGAG-3′; reverse:5′-CTCAAAGAGTGGAGTGCTCGCCTGGCATGCCCAGGGCCGGAGTTCAATCACCAGGACTGT-3′. Mut competitor sequence, forward: 5′-GTGACTTCAACAGCCAGGTCTTAATTTCAAATGCATTGAATAGATGTCTTGTCTCCCAGA-3′; reverse: 5′-TCTGGGAGACAAGACATCTATTCAATGCATTTGAAATTAAGACCTGGCTGTTGAAGTCAC-3′. For competition assays, a 50-fold excess of unlabeled probe was added. GC contents of the sequences were labeled as indicated. Bar graph showing the ratio of the gray value of samples from different lanes to that of the WT probe group. n = 3 per group. P value was calculated by the Student’s t-test. Enrichment of SYCP3 on autosomes and sex chromosomes in WT (G) and Scml2-KO (H) spermatocytes (center ± 2.0 kb).
Figure 2.
Figure 2.
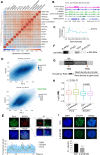
SYCP3 occupancy is positively correlated with active chromatin marks and Pol II enrichment in spermatocytes. (A) Heatmap of pairwise Spearman correlation of chromatin association of SYCP3/1, histone marks, Pol II, CTCF, and DMC1-labeled DSB hotspots in spermatocytes. (B) IGV genome browser snapshots of enrichment of SYCP3, Pol II, H4K8ac, lysine crotonylation, and DMC1 in spermatocytes. (C) Diagram showing SYCP3 distribution along genic regions in spermatocytes. (D) The 2D density plots of SYCP3 intensity versus Pol II intensity at gene promoters/gene body regions show a positive correlation. Here, TSS regions were defined as 1 kb flanking TSS. Gene body regions were defined as 1 kb downstream of TSS to Transcription End Site (TES). (E) Co-immunostaining of SYCP3 and Pol II in meiotic chromosome spread of pachytene spermatocytes. DNA was stained by 4',6-diamidino-2-phenylindole (DAPI). Scale bar, 10 μm. The line chart shows the distribution of the fluorescence intensities along the dashed line (lower). Immunofluorescence of the sex chromosome portion is shown on the right. Scale bar, 5 μm. (F) Immunoblotting of RPB1 (the largest subunit of Pol II) after immunoprecipitation with IgG, anti-RPB1 antibody, and anti-SYCP3 antibody from adult testicular lysate, using input without immunoprecipitation as positive control. (G) Scheme of occupancy ratio (OR) definition as chromatin occupancy (quantified as normalized read density) at the promoter (1 kb flanking TSS) versus gene body (1 kb downstream of TSS to TES). (H) Boxplot indicating changes of OR values of Pol II and SYCP3 occupancy upon α-amanitin treatment. P value was calculated by the Wilcoxon rank-sum test. (I) Immunofluorescence staining and the fluorescence intensity of SYCP3 in chromosome spread of pachytene spermatocytes from control and α-amanitin treatment group. Scale bar, 10 μm.
Figure 3.
Figure 3.
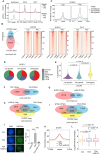
Comparison of chromatin occupancy of SYCP3, Pol II, and γH2A.X in leptotene and pachytene spermatocytes. (A) Changes of the enrichment of SYCP3 and γH2A.X on the autosome, X and Y chromosome in leptotene (Lep) and pachytene (Pac) spermatocytes (2.0 kb flanking peak center). (B) Venn diagram showing the overlap of SYCP3 peaks in pachytene and leptotene spermatocytes. Heatmap showing the enrichment of SYCP3, γH2A.X, and Pol II in leptotene and pachytene spermatocytes at overlapped peak regions of the two stages. (C) Density plot of SYCP3 occupancy at leptotene-specific, pachytene-specific, and overlapped SYCP3 peaks (2.0 kb flanking peak center) in leptotene and pachytene spermatocytes. (D) Pie plots indicating genomic distribution of SYCP3 binding at stage-specific peaks and overlapping peaks in leptotene and pachytene spermatocytes. (E) Peak length distribution of stage-specific and overlapping SYCP3 peaks in leptotene and pachytene spermatocytes. (FG) Venn diagrams showing the overlap of Pol II/γH2A.X peaks in pachytene and leptotene spermatocytes. (H, I) Venn diagrams showing the overlap of SYCP3, Pol II, and γH2A.X peaks in pachytene and leptotene spermatocytes. (J) Immunofluorescence staining and the fluorescence intensity of H3K27ac in pachytene spermatocytes. DNA was stained by DAPI. Con group, control without drug treatment. TSA group, pachytene spermatocytes were treated with 100 nM TSA for 3 h. TSA washout group, pachytene spermatocytes were recovered for 3 h without drugs after TSA treatment. (K) Intensity of SYCP3 occupancy at SYCP3-binding sites in Con, TSA, and TSA washout groups of pachytene spermatocytes (2 kb flanking peak center). (L) Boxplot shows quantification of SYCP3 occupancy at SYCP3-binding sites in Con, TSA, and TSA washout groups of pachytene spermatocytes. P value was calculated by the Wilcoxon rank-sum test.
Figure 4.
Figure 4.
Identification and characterization of core SYCP3 binding sites. (A) Venn diagram showing the overlap of SYCP3 peaks in pachytene spermatocytes without (SYCP3) and with 1,6-HD treatment (SYCP3-1,6-HD). (B) Intensity and heatmap of SYCP3 occupancy at SYCP3-Core and SYCP3-NonCore sites in pachytene spermatocytes (2 kb flanking center). (CD) Intensity of Pol II and CTCF occupancy at SYCP3-Core and SYCP3-NonCore sites in pachytene spermatocytes (2 kb flanking center). (E) Gene Ontology analysis of genes with promoters containing SYCP3-Core sites or SYCP3-NonCore sites. (F) Putative binding motifs enriched in SYCP3-Core sites by HOMER algorithm.
Figure 5.
Figure 5.
Identification of SYCP1 binding sites in pachytene spermatocytes. (A) IGV genome browser snapshots of occupancy of SYCP3, SYCP1, Pol II, REC8, and RAD21L in mouse spermatocytes. (B) Gene Ontology analysis on genes with promoters containing SYCP3 peaks in leptotene, SYCP3 peaks in pachytene, and SYCP1 peaks in pachytene, respectively. (C) Venn diagrams showing the overlap of SYCP1, SYCP3, and SYCP3-Core in spermatocytes. (D) Venn diagrams showing the overlap of SYCP3, SYCP1, and REC8 in spermatocytes. (E, F) Intensity of DNA methylation and chromatin accessibility of SYCP3-Core, SYCP3-NonCore, and SYCP1 peaks in spermatocytes by WGBS and ATAC-seq. (GK) Intensity of chromatin association of Pol II (G), SYCP3 (H), CTCF (I), REC8 (J), and RAD21L (K) at SYCP3-Core, SYCP3-NonCore, and SYCP1 peaks (2 kb flanking center) in spermatocytes.
Figure 6.
Figure 6.
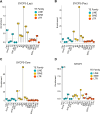
Characterization of SYCP3/1 binding at repetitive elements in spermatocytes. Diagram showing the enrichment of TE families, including SINEs, LINEs, and LTR in SYCP3-Lep (A), SYCP3-Pac (B), SYCP3-Core (C), and SYCP1 peaks (D). Dashed lines indicate an enrichment value of 1 representing no enrichment.
Figure 7.
Figure 7.
Characterization of SYCP3/1 distribution at sex chromosomes in spermatocytes. (A) Venn diagrams showing the overlap of SYCP3 peaks at sex chromosomes in pachytene and leptotene spermatocytes. (B) Intensity of SYCP3 occupancy at sex chromosomes and autosomes in pachytene spermatocytes (2 kb flanking peak center). (C) Heatmap of pairwise Spearman correlation of chromatin association of SYCP3/1, H3.3, histone marks, and CTCF at sex chromosomes of spermatocytes. (D) Intensity of H3.3 occupancy at SYCP3-occupied sites from sex chromosomes and autosomes in pachytene spermatocytes (2 kb flanking peak center). (E) IGV genome browser snapshot of chromatin occupancy of SYCP3 and H3.3 at X chromosome in mouse pachytene spermatocytes. (F) Intensity of SYCP3 occupancy at SYCP3-Core and SYCP3-NonCore sites at sex chromosomes in pachytene spermatocytes (2 kb flanking peak center). (G) Venn diagram showing the overlap of SYCP3 peaks at sex chromosomes without (SYCP3) and with 1,6-HD treatment (SYCP3-1,6-HD) in pachytene spermatocytes. (H) Intensity of SYCP3 occupancy at SYCP1, SYCP3-Core, and SYCP3-NonCore sites at sex chromosomes in pachytene spermatocytes (2 kb flanking peak center). (I) Venn diagrams showing the overlap of SYCP3 , SYCP1, and REC8 peaks at sex chromosomes in pachytene spermatocytes.
Figure 8.
Figure 8.
Schematic of how SYCP3 is involved in the organization of meiotic chromatin architecture. Violin plots comparing log2(inter-peak distance) (A) and log2(peak width) (B) of indicated peaks. SYCP3 (Pac) group was used as a reference to calculate P values by the Wilcoxon rank-sum test. (C) Model illustrating meiotic chromatin architecture in leptotene and pachytene spermatocytes, with occupancy of SYCP3/1 and related chromatin features indicated.

References

    1. Zickler D, Kleckner N Recombination, pairing, and synapsis of homologs during meiosis. Cold Spring Harb Perspect Biol. 2015; 7:a016626.10.1101/cshperspect.a016626. - DOI - PMC - PubMed
    1. Cahoon CK, Hawley RS Regulating the construction and demolition of the synaptonemal complex. Nat Struct Mol Biol. 2016; 23:369–77.10.1038/nsmb.3208. - DOI - PubMed
    1. Syrjanen JL, Pellegrini L, Davies OR A molecular model for the role of SYCP3 in meiotic chromosome organisation. eLife. 2014; 3:e02963.10.7554/eLife.02963. - DOI - PMC - PubMed
    1. Yuan L, Liu JG, Zhao J et al. . The murine SCP3 gene is required for synaptonemal complex assembly, chromosome synapsis, and male fertility. Mol Cell. 2000; 5:73–83.10.1016/S1097-2765(00)80404-9. - DOI - PubMed
    1. de Vries FAT, de Boer E, van den Bosch M et al. . Mouse Sycp1 functions in synaptonemal complex assembly, meiotic recombination, and XY body formation. Genes Dev. 2005; 19:1376–89.10.1101/gad.329705. - DOI - PMC - PubMed

LinkOut - more resources