. 2025 Jan 2;19(1):wraf117.
doi: 10.1093/ismejo/wraf117.

Chemosynthesis enhances net primary production and nutrient cycling in a hypersaline microbial mat

Affiliations

Chemosynthesis enhances net primary production and nutrient cycling in a hypersaline microbial mat

Francesco Ricci et al. ISME J. .

Abstract

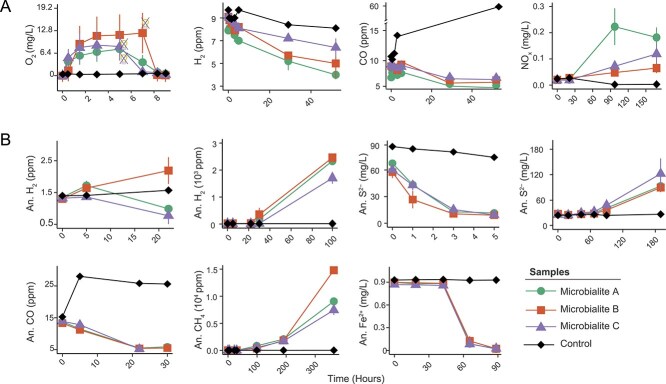
Photosynthetic microbial mats are macroscopic microbial ecosystems consisting of a wide array of functional groups and microenvironments arranged along variable redox gradients. Light energy ultimately drives primary production and a cascade of daisy-chained metabolisms. Heterotrophic members of these communities remineralise organic material, decreasing net primary production, and returning nutrients to the aqueous phase. However, reduced inorganic and one-carbon substrates such as trace gases and those released as metabolic byproducts in deeper anoxic regions of the mat, could theoretically also fuel carbon fixation, mitigating carbon loss from heterotrophy and enhancing net primary production. Here, we investigated the intricate metabolic synergies that sustain community nutrient webs in a biomineralising microbial mat from a hypersaline lake. We recovered 331 genomes spanning 40 bacterial and archaeal phyla that influence the biogeochemistry of these ecosystems. Phototrophy is a major metabolism found in 17% of the genomes, but over 50% encode enzymes to harness energy from inorganic substrates and 12% co-encode chemosynthetic carbon fixation pathways that use sulfide and hydrogen as electron donors. We experimentally demonstrated that the microbial community oxidises ferrous iron, ammonia, sulfide, and reduced trace gas substrates aerobically and anaerobically. Furthermore, carbon isotope assays revealed that diverse chemosynthetic pathways contribute significantly to carbon fixation and organic matter production alongside photosynthesis. Chemosynthesis in microbial mats results from a complex suite of spatially organised metabolic interactions and continuous nutrient cycling, which decouples carbon fixation from the diurnal cycle, and enhances the net primary production of these highly efficient ecosystems.

Keywords: carbon fixation; chemosynthesis; extreme environments; isotopes; metabolic interactions; metagenomics; microbial mat; microbialites.


Conflict of interest statement

The authors declare no conflict of interest.

Figures

Figure 1
Figure 1
(A) Maximum-likelihood genome tree depicting the taxonomic diversity of 331 archaeal and bacterial metagenome-assembled genomes (MAGs), built with 1,000 ultrafast bootstrap replicates using the LG + C10 + F + G and WAG+G20 models, respectively. (B) Metabolic potential of microbes co-encoding energy acquisition enzymes with carbon fixation pathways. The side bargraph shows the number of MAGs in each microbial family (GTDB taxonomy). (C) the bottom heatmap shows the abundance of each gene in the metagenomic short reads in West Basin Lake samples (underlined) and across 17 publicly available microbialite community metagenomes from five global sites encompassing Alchichica Lake, Socompa Lake, Highborne Cay, Shark Bay, and Rio Mesquites. Homology-based searches were used to identify signature genes encoding enzymes associated with metabolic pathways. To infer abundance, read counts were normalized to gene length and the abundance of single-copy marker genes. Bacteria and Archaea phylogenetic trees scale bars are both 0.1.
Figure 2
Figure 2
Conceptual overview of the community metabolic interactions based on genome- and gene-resolved data of the dominant microbial guilds within the microbialite communities of West Basin Lake. This overview represents the inferred metabolic pathways and interactions based on the genomic content of these guilds. Dashed lines indicate the direction of electron acceptors and donors. The graphic is an artistic generalisation of the data and should not be interpreted as an exact depiction of the microbial community structure. Asterisk (*) denotes that specific metabolic marker genes were exclusively recovered from metagenomic short-read data. Lightning bolts represent light energy. The background image shows a microbialite cross section.
Figure 3
Figure 3
Biogeochemical assays illustrating the metabolic activities of microbialite communities under aerobic (A) and anaerobic (B) conditions in incubations. Oxygen dynamics were assessed using chemical imaging on independent microbialite samples incubated in 4 L glass aquaria, with data presented as the mean ± standard deviation for representative time points of defined photosynthetic regions of interest. Oxygen dynamics for each region of interest throughout the entire experiment are presented in supplementary Fig. 3. Trace gases, sulfide and ferrous ion measurements were taken in 120 ml sealed serum vial containing 10 g of microbialite slurry and 50 ml of 0.22 μm-filtered lake water. Trace gas incubations were supplemented with 10 ppm H2, CH4, and CO in the headspace. S2− and Fe2+ incubations were supplied with either 100 μM Na₂S·9H₂O (only for consumption) or 6 mM FeCl₂. All anaerobic incubations except for S2− production were supplemented with 1.5 mM NO3 as an electron acceptor. Nitrification (NOx = NO2 + NO3) measurements were taken in uncapped 250 ml Schott bottles containing ~10 g of microbialite slurry, 100 ml of 0.22 μm-filtered lake water and 100 μM NH4+. In the oxygen plot, crossed-off light bulbs indicate the time when light was switched off, mimicking the onset of darkness. All incubation experiments were performed in triplicate, with results expressed as the mean ± standard deviation across three replicates.
Figure 4
Figure 4
Dominant carbon fixation pathways and activities in microbialite communities. Maximum-likelihood phylogenetic trees of 140 RbcL (A), 184 AcsB (B), and 36 AclB (C) amino acid sequences obtained from the three microbialite samples, constructed using 1000 ultrafast bootstrap replicates. The LG + R5 (A), LG + F + I + R6 (B), and LG + I + G4 (C) substitution models were applied. Sequences derived from binned contigs are classified at the phylum level. Phylogenetic trees scale bars are 0.1. Bootstrap support values ≥90 are denoted by white circles (A–C). 14CO2 incorporation by microbialite incubations supplemented with different energy sources (light [40 μmol m−2 s−1], H2 [100 ppm], S2− [0.8 mM], and NH4+ [1 mM]) (D). Credible intervals of effect (electron donors) relative to dark condition denoting 2.5th and 97.5th (thin bar) and 25th and 75th (thick bar) percentiles of posterior probability distribution (D). The rates do not represent gross carbon fixation rates due to the presence of unlabelled native inorganic carbon (average ~5.57 ± 1.4%; Supplementary Data 1) and internally recycled CO2 within samples (D). Please refer to materials and methods section “14C incorporation analysis” for detailed information on the hierarchical Bayesian model used to analyse these data and the reasoning behind the exclusion of microbialite C and H2 assays (D). Boxplot showing the carbon isotope fractionation (εDIC-organic in ‰, Vienna pee Dee belemnite standard) between dissolved inorganic carbon (DIC) and organic carbon of three independent microbialites (12 replicates each) (E). Note that the reported fractionation factor of 2.7‰ for aragonite [57] was used to estimate δ13C of DIC from δ13C of carbonate fraction, though the primary mineral of sampled microbialites is more likely to be hydromagnesite (E). Enclosed boxplot shows the natural abundance of carbon isotope compositions (δ13C) of the carbonate and organic fractions of the microbialites (E). Coloured bars depict the range of literature εDIC-organic values of cellular biomass produced from 3-hydroxypropionate cycle [58, 59] (3HP), 4-hydroxybutyrate cycle of ammonia oxidising archaea [60–62] (AOA 4HB), reductive tricarboxylic acid cycle [59, 63, 64] (rTCA), wood–Ljungdahl pathway [59] (WL), and Calvin-Benson-Bassham cycle [53, 58, 59] (CBB) (E).

Similar articles

References

    1. Walter MR, Buick R, Dunlop JSR. Stromatolites 3,400–3,500 Myr old from the north pole area. Western Australia Nature 1980;284:443–5.
    1. Van Kranendonk MJ, Philippot P, Lepot K. et al. Geological setting of Earth’s oldest fossils in the ca. 3.5 Ga dresser formation, Pilbara craton, Western Australia. Precambrian Res 2008;167:93–124.
    1. Dick GJ, Grim SL, Klatt JM. Controls on O 2 production in cyanobacterial Mats and Implications for Earth’s oxygenation. Annu Rev Earth Planet Sci 2018;46:123–47.
    1. Cavalier-Smith T. Cell evolution and earth history: stasis and revolution. Philos Trans R Soc B 2006;361:969–1006. - PMC - PubMed
    1. Nisbet EG, Fowler CMR. Archaean metabolic evolution of microbial mats. Proc R Soc Lond B 1999;266:2375–82.

LinkOut - more resources