. 2025 Jun 9;22(6):690-713.
doi: 10.20892/j.issn.2095-3941.2025.0014.

Cancer cell-derived migrasomes harboring ATF6 promote breast cancer brain metastasis via endoplasmic reticulum stress-mediated disruption of the blood-brain barrier

Affiliations

Cancer cell-derived migrasomes harboring ATF6 promote breast cancer brain metastasis via endoplasmic reticulum stress-mediated disruption of the blood-brain barrier

Song Wang et al. Cancer Biol Med. .

Abstract

Objective: Migrasomes, an emerging class of migration-facilitating membranous extracellular vesicles, remain largely uncharted in the intricate landscape of tumor metastasis. This study aimed to illuminate the roles and mechanisms underlying cancer cell-derived migrasomes in breast cancer brain metastasis (BCBM).

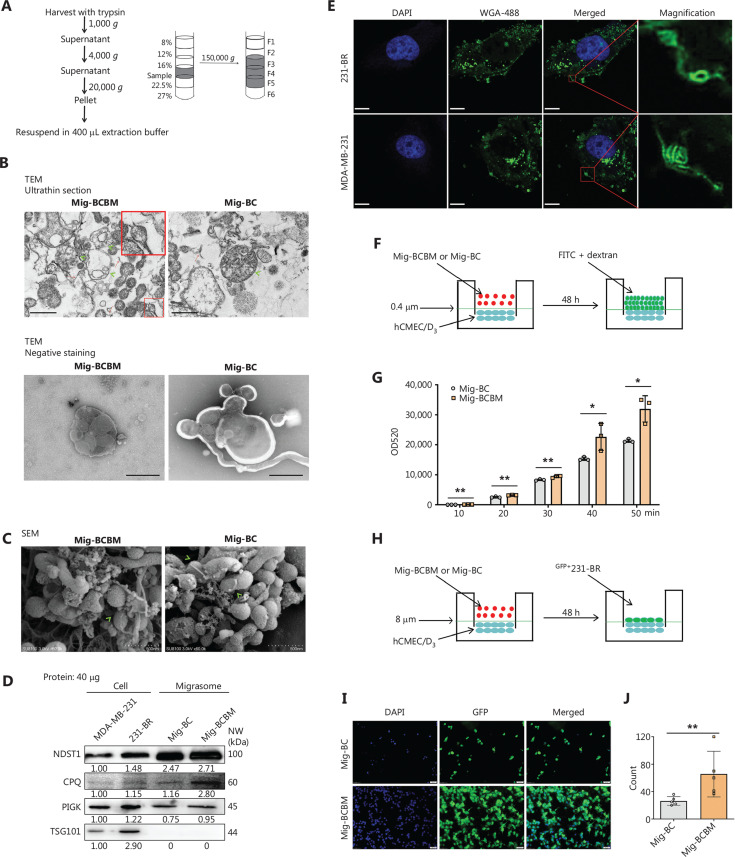
Methods: Migrasomes were isolated and purified from BCBM cells (231-BR) and non-specific organotropic parental counterparts (MDA-MB-231), specifically designated as Mig-BCBM and Mig-BC, respectively. The role of Mig-BCBM in BCBM was investigated using an in vitro endothelial cell layer permeability model and a BCBM mouse model. The regulatory mechanism underlying Mig-BCBM was assessed using RT-qPCR, western blotting, immunofluorescence, ex vivo fluorescence imaging, and a series of rescue experiments.

Results: Mig-BCBM potently augmented the permeability of vascular endothelial layers, which facilitated the efficient migration of 231-BR cells across endothelial barriers in vitro. The administration of Mig-BCBM significantly disrupted the blood-brain barrier (BBB) and accelerated BCBM progression in vivo, as evidenced in mouse models, compared to the Mig-BC and control groups. Mechanistically, Mig-BCBM harbored ATF6, a critical transducer of endoplasmic reticulum (ER) stress. Upon internalization into hCMEC/D3 cells, ATF6 elicited robust ER stress responses, culminating in downregulation of ZO-1 and VE-cadherin. Digital PCR analysis disclosed significant upregulation of ATF6 in serum migrasomes derived from BCBM patients compared to migrasomes from breast cancer patients and healthy individuals.

Conclusions: This study uncovered a pivotal role of cancer cell-derived in BCBM by harnessing ATF6-mediated ER stress to disrupt the BBB and promote metastasis, suggesting novel diagnostic and therapeutic strategies targeting migrasomes and migrasome cargo.

Keywords: ATF6; Breast cancer brain metastasis; blood-brain barrier; endoplasmic reticulum stress; migrasome.


Conflict of interest statement

No potential conflicts of interest are disclosed.

Figures

Figure 1
Figure 1
Mig-BCBM facilitates 231-BR cell migration through vascular endothelial layers in vitro. (A) Isolation and purification of migrasomes. 231-BR or MDA-MB-231 cell-derived migrasomes were isolated and purified using density gradient centrifugation. (B) TEM imaging of migrasomes. TEM revealed the ultrastructural features of isolated migrasomes. The green arrows indicate migrasomes. The red arrows indicate retraction fibers. In the left panel of the ultrathin section, the magnified view in the upper right corner corresponds to the area marked by the red box. Scale bars, 500 nm. (C) SEM visualization of migrasomes. The green arrows indicate migrasomes. Scale bar, 500 nm. (D) Western blotting analysis of 231-BR or MDA-MB-231 cells and cell-derived migrasome Mig-BCBM and Mig-BC using antibodies against NDST1, CPQ, PIGK, and TSG101. 231-BR and MDA-MB-231 cells, along with Mig-BCBM and Mig-BC, were normalized with total protein. The grey values of the western blot bands were quantified using ImageJ software. (E) 231-BR or MDA-MB-231 cell-derived migrasomes were stained with WGA probes. The magnified images in the right panel correspond to the areas delineated by the red boxes. Scale bars, 5 μm. (F) Schematic of endothelial cell layer permeability assay. Polyethylene terephthalate membrane, 0.4 μm pore size. (G) Effect of Mig-BCBM on hCMEC/D3 cell layer permeability. n = 3. (H) Schematic of GFP+231-BR cell migration through vascular endothelial layers. Polyethylene terephthalate membrane, 8 μm pore size. (I) Effect of Mig-BCBM on the migration of 231-BR cells across vascular endothelial layers. Representative images of GFP+231-BR cell migration through vascular endothelial layers. Scale bars, 50 μm. (J) Quantification of GFP+231-BR cell migration through vascular endothelial layers. n = 5; *P < 0.05, **P < 0.01.
Figure 2
Figure 2
Mig-BCBM enhances BBB permeability and promotes BCBM in vivo. (A) Schematic illustration of a model designed to detect the effect of Mig-BCBM or Mig-BC on BCBM. (B and C) Effect of Mig-BCBM on BCBM in vivo. H&E staining of brain tissues (B) and quantification of brain metastases (C). Top right: H&E-stained whole brain section (scale bars, 1 mm). Brain metastasis nodule images (scale bars, 50 μm) show magnified view of black-framed area. n = 5. (D) Schematic illustration of a model designed to detect the effect of Mig-BCBM on disrupting BBB. (E and F) Effect of Mig-BCBM on BBB permeability. Evans blue (EB) fluorescence images (E) and concentration (F) in the brains. Scale bars, 10 μm. n = 5; *P < 0.05, **P < 0.01, ***P < 0.001.
Figure 3
Figure 3
Mig-BCBM modulates BBB permeability by altering ZO-1 and VE-cadherin expression in hCMEC/D3 cells. (A) Internalization of Mig-BCBM into hCMEC/D3 cells. hCMEC/D3 cells were incubated with WGA-labeled Mig-BCBM for 24 h. The right panel shows the line profile of representative cell images in the dashed box using Image-Pro Plus software. The right panel shows the line profile of the image of a representative cell within the dashed box, generated using the Image-Pro Plus software. The fluorescence images revealed efficient endocytosis of Mig-BCBM into hCMEC/D3 cells. Scale bar, 10 μm. (B) Downregulation of ZO-1 and VE-cadherin mRNA expression by Mig-BCBM. n = 3 (C and D) Decrease in ZO-1 (C) and VE-cadherin (D) protein expression following Mig-BCBM treatment. n = 3. (E and F) Effects of Mig-BCBM on the expression, but not subcellular localization, of ZO-1 and VE-cadherin. Immunofluorescence staining revealed that Mig-BCBM treatment reduced the levels of ZO-1 and VE-cadherin expression in hCMEC/D3 cells without affecting the subcellular localization. Scale bar, 20 μm. (G and H) Effects of Mig-BCBM on ZO-1 and VE-cadherin expression in mouse brains. Mig-BCBM (200 μg/mL) was injected into the mice brain. ZO-1 and VE-cadherin mRNA (G) and protein (H) expression was downregulated. n = 3; *P < 0.05, **P < 0.01, ***P < 0.001.
Figure 4
Figure 4
Mig-BCBM induces ER stress in hCMEC/D3 cells. (A) Volcano plot depicting differential abundance proteins in Mig-BCBM compared to Mig-BC. Mig-BCBM and Mig-BC underwent 4D label-free quantitative mass spectrometry analysis. The red dots signify a Mig-BCBM/Mig-BC abundance ratio ≥ 2 (P < 0.01), while the green dots denote a Mig-BCBM/Mig-BC abundance ratio ≤ 0.5 (P < 0.01). n = 3 biologically independent experiments. (B) ATF6 expression in Mig-BCBM compared to Mig-BC. Mig-BCBM and Mig-BC were normalized with total protein and subjected to western blotting analysis. The gray values of the western blotting bands were quantified using ImageJ software. (C and D) Enhanced ATF6 expression in 231-BR cells. RT-qPCR (C) and western blotting (D) analyses revealed a significant upregulation of ATF6 in 231-BR cells compared to MDA-MB-231 cells. n = 3. (E) Elevated expression of ER stress markers in hCMEC/D3 cells treated with Mig-BCBM. RT-qPCR analyses revealed significant upregulation of six ER stress markers, including ATF6, GRP78, CHOP, ATF4, EIF2AK3, and PPPIR15A, in hCMEC/D3 cells that had been exposed to Mig-BCBM. n = 3. (F) Enhanced protein expression of ER stress markers in Mig-BCBM-treated hCMEC/D3 cells. Western blotting analyses confirmed the elevated protein levels of three ER stress markers (ATF6, GRP78, and CHOP) in hCMEC/D3 cells that were subjected to treatment with Mig-BCBM. n = 3. (G) Protein expression of additional ER pathway markers (PERK and IRE1 pathways). Western blot analyses revealed no significant changes in p-PERK, p-eIF2α, or IRE1α in Mig-BCBM-treated hCMEC/D3 cells compared to Mig-BC. n = 3; *P < 0.05, **P < 0.01; ns, no significance.
Figure 5
Figure 5
Mig-BCBM induces ER stress in mouse brains in vivo. (A) Elevated transcript levels of GRP78, CHOP, and ATF6 in Mig-BCBM-exposed mouse brains. (B) Enhanced expression of GRP78, CHOP, and ATF6 protein in Mig-BCBM-treated mouse brains. *P < 0.05, **P < 0.01.
Figure 6
Figure 6
Mig-BCBM reverses ZO-1 and VE-cadherin upregulation induced by ATF6 knockdown in hCMEC/D3 cells. (A–C) Efficient knockdown of ATF6 in hCMEC/D3 cells. The knockdown efficiency of ATF6 in hCMEC/D3 cells was examined using immunofluorescent staining (A), RT-qPCR (B), and western blotting (C). Scale bars, 50 μm; n = 3. (D–E) ATF6 knockdown upregulates ZO-1 and VE-cadherin expression, which is reversed by Mig-BCBM. The mRNA (D) and protein (E) levels were upregulated after ATF6 knockdown in hCMEC/D3 cells, but this phenomenon was reversed after the addition of Mig-BCBM. n = 3. (F) ATF6 knockdown inhibits the metastatic potential of 231-BR cells traversing vascular endothelial barriers, but this phenomenon was reversed after the addition of Mig-BCBM. Scale bars, 50 μm; n = 5. (G) Efficient knockdown of ATF6 in Mig-BCBM (Mig-shATF6). n = 3. (H) Effect of Mig-shATF6 on hCMEC/D3 cell layer permeability. n = 3. (I) Scale bars, 50 μm. Effect of Mig-shATF6 on the migration of 231-BR cells across vascular endothelial layers. Quantification of GFP+231-BR cell migration through vascular endothelial layers. n = 5; *P < 0.05, **P < 0.01, ***P < 0.001.
Figure 6
Figure 6
Mig-BCBM reverses ZO-1 and VE-cadherin upregulation induced by ATF6 knockdown in hCMEC/D3 cells. (A–C) Efficient knockdown of ATF6 in hCMEC/D3 cells. The knockdown efficiency of ATF6 in hCMEC/D3 cells was examined using immunofluorescent staining (A), RT-qPCR (B), and western blotting (C). Scale bars, 50 μm; n = 3. (D–E) ATF6 knockdown upregulates ZO-1 and VE-cadherin expression, which is reversed by Mig-BCBM. The mRNA (D) and protein (E) levels were upregulated after ATF6 knockdown in hCMEC/D3 cells, but this phenomenon was reversed after the addition of Mig-BCBM. n = 3. (F) ATF6 knockdown inhibits the metastatic potential of 231-BR cells traversing vascular endothelial barriers, but this phenomenon was reversed after the addition of Mig-BCBM. Scale bars, 50 μm; n = 5. (G) Efficient knockdown of ATF6 in Mig-BCBM (Mig-shATF6). n = 3. (H) Effect of Mig-shATF6 on hCMEC/D3 cell layer permeability. n = 3. (I) Scale bars, 50 μm. Effect of Mig-shATF6 on the migration of 231-BR cells across vascular endothelial layers. Quantification of GFP+231-BR cell migration through vascular endothelial layers. n = 5; *P < 0.05, **P < 0.01, ***P < 0.001.
Figure 7
Figure 7
Mig-BCBM enhances BCBM via the induction of ER stress. (A) Mig-BCBM rescued the downregulation of CHOP, GRP78, and ATF6 caused by 4-PBA in hCMEC/D3 cells. n = 3. (B) Mig-BCBM rescued the upregulation of ZO-1 and VE-cadherin caused by 4-PBA in hCMEC/D3 cells. n = 3. (C) 4-PBA reversed the Mig-BCBM-induced downregulation of ZO-1 and VE-cadherin in vivo. n = 3. (D) Schematic illustration of an in vivo rescue experiment to confirm the role of Mig-BCBM in enhancing BCBM through ER stress. The mice were intraperitoneally injected with 4-PBA, followed by the administration of Mig-BCBM through the tail vein 2 h later. The mice underwent a twice-weekly injection schedule for 4 weeks. The BCBM models were established by injecting GFP+231-BR cells into the left ventricle. (E–F) 4-PBA reduced the brain metastases caused by Mig-BCBM in vivo. Fluorescence images of GFP+231-BR cells (E). Whole-brain ex vivo fluorescence images and ROI value of fluorescence intensity of mouse metastases (F). n = 3; *P < 0.05, **P < 0.01.
Figure 7
Figure 7
Mig-BCBM enhances BCBM via the induction of ER stress. (A) Mig-BCBM rescued the downregulation of CHOP, GRP78, and ATF6 caused by 4-PBA in hCMEC/D3 cells. n = 3. (B) Mig-BCBM rescued the upregulation of ZO-1 and VE-cadherin caused by 4-PBA in hCMEC/D3 cells. n = 3. (C) 4-PBA reversed the Mig-BCBM-induced downregulation of ZO-1 and VE-cadherin in vivo. n = 3. (D) Schematic illustration of an in vivo rescue experiment to confirm the role of Mig-BCBM in enhancing BCBM through ER stress. The mice were intraperitoneally injected with 4-PBA, followed by the administration of Mig-BCBM through the tail vein 2 h later. The mice underwent a twice-weekly injection schedule for 4 weeks. The BCBM models were established by injecting GFP+231-BR cells into the left ventricle. (E–F) 4-PBA reduced the brain metastases caused by Mig-BCBM in vivo. Fluorescence images of GFP+231-BR cells (E). Whole-brain ex vivo fluorescence images and ROI value of fluorescence intensity of mouse metastases (F). n = 3; *P < 0.05, **P < 0.01.
Figure 8
Figure 8
Expression of ATF6 in serum migrasomes of BCBM patients. (A) Flowchart of isolation and purification of serum migrasomes. (B–D) Identification and characterization of serum migrasomes. The human serum migrasomes were identified using TEM (B), SEM (C), and western blotting (D). The green arrows indicate migrasomes in (B). Scale bars, 0.3 μm in (B) and 1 μm in (C). (E) Elevated protein levels of ATF6 in serum migrasome samples of BCBM patients compared to BC patients and healthy controls. n = 3. (F and G) Evaluation of ATF6 mRNA expression in serum migrasomes utilizing digital PCR (dPCR). Representative imaging obtained from the dPCR analysis of ATF6 mRNA expression within serum migrasomes (F) and quantitative analysis (G). BCBM, n = 32; BC, n = 36; control, n = 41; **P < 0.01, ***P < 0.001.
Figure 9
Figure 9
Schematic diagram of the proposed mechanism of Mig-BCBM in BBB disruption. Step-by-step mechanism: ① Mig-BCBM, derived from brain metastatic breast cancer cells, enters the brain microvasculature via the bloodstream. ② The Mig-BCBM migrasome membrane, enriched in cholesterol, sphingomyelin, and tetraspanins (e.g., TSPAN4), may form liquid-ordered lipid raft microdomains. These structural features enhance membrane fluidity, facilitating fusion with brain endothelial cells and subsequent cargo release. Mig-BCBM cargo contains ATF6 but lacks PERK and IRE1 pathway components. ATF6, a key ER stress sensor and transcription factor, translocates to the Golgi apparatus upon ER stress. Golgi-resident zinc metalloproteinases S1P/S2P sequentially cleave ATF6 to release the active fragment, ATF6p50. ③ ATF6p50 enters the nucleus, binds to the CHOP promoter, and upregulates CHOP expression. As an ER stress-inducible transcription factor, CHOP may bind to the promoter regions of ZO-1 and VE-cadherin, suppressing transcriptional activity. ④ Downregulation of ZO-1 and VE-cadherin disrupts tight junctions and adherens junctions, leading to BBB leakage. This compromised barrier facilitates the transendothelial migration of brain metastatic breast cancer cells. ER, endoplasmic reticulum; ATF6, activating transcription factor-6; PERK, protein kinase RNA-like endoplasmic reticulum kinase; IRE1, inositol-requiring enzyme 1; S1P/S2P, site-1 protease/site-2 protease; CHOP, C/EBP-homologous protein; ZO-1, zonula occludens 1; BBB, blood-brain barrier.

References

    1. Harbeck N, Penault-Llorca F, Cortes J, Gnant M, Houssami N, Poortmans P, et al. Breast cancer. Nat Rev Dis Primers. 2019;5:66. - PubMed
    1. Sun H, Xu J, Dai S, Ma Y, Sun T. Breast cancer brain metastasis: current evidence and future directions. Cancer Med. 2023;12:1007–24. - PMC - PubMed
    1. Aizer AA, Lamba N, Ahluwalia MS, Aldape K, Boire A, Brastianos PK, et al. Brain metastases: a Society for Neuro-Oncology (SNO) consensus review on current management and future directions. Neuro Oncol. 2022;24:1613–46. - PMC - PubMed
    1. Giordano G, Griguolo G, Landriscina M, Meattini I, Carbone F, Leone A, et al. Multidisciplinary management of HER2-positive breast cancer with brain metastases: an evidence-based pragmatic approach moving from pathophysiology to clinical data. Crit Rev Oncol Hematol. 2023;192:104185. - PubMed
    1. Mu R, Sun H, Zeng Y, Tong Y, Tang P, Zhao M, et al. Nanomodulators targeting endothelial WNT and pericytes to reversibly open the blood-tumor barrier for boosted brain tumor therapy. J Control Release. 2024;369:458–74. - PubMed

MeSH terms

Substances

LinkOut - more resources