. 2025 Jun 9:13:RP103620.
doi: 10.7554/eLife.103620.

Heterozygosity for neurodevelopmental disorder-associated TRIO variants yields distinct deficits in behavior, neuronal development, and synaptic transmission in mice

Affiliations

Heterozygosity for neurodevelopmental disorder-associated TRIO variants yields distinct deficits in behavior, neuronal development, and synaptic transmission in mice

Yevheniia Ishchenko et al. Elife. .

Abstract

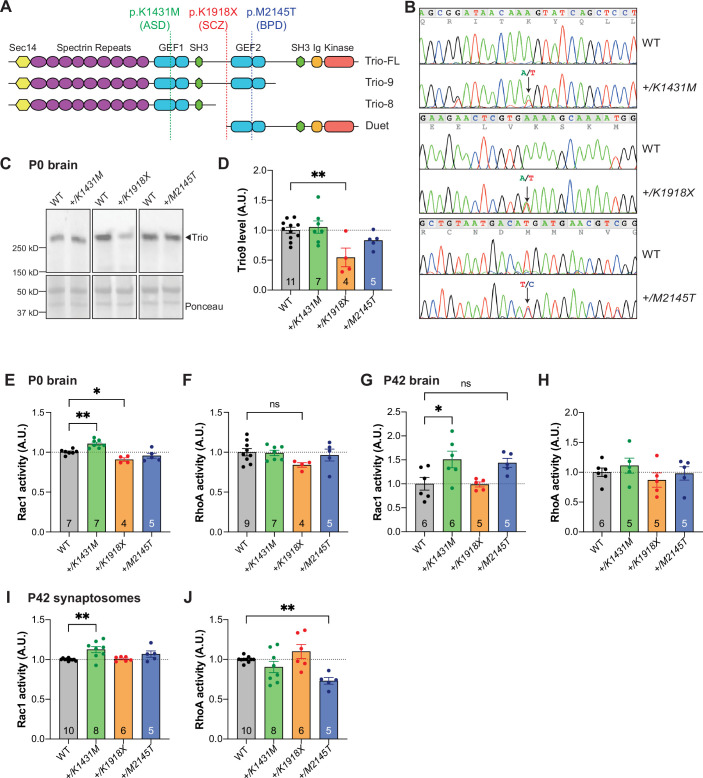
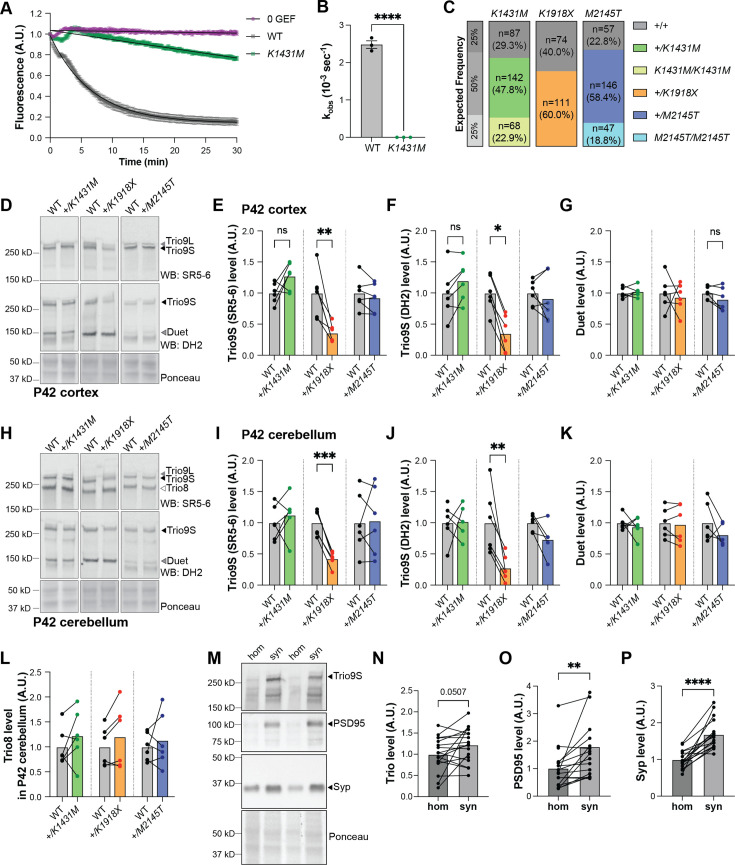
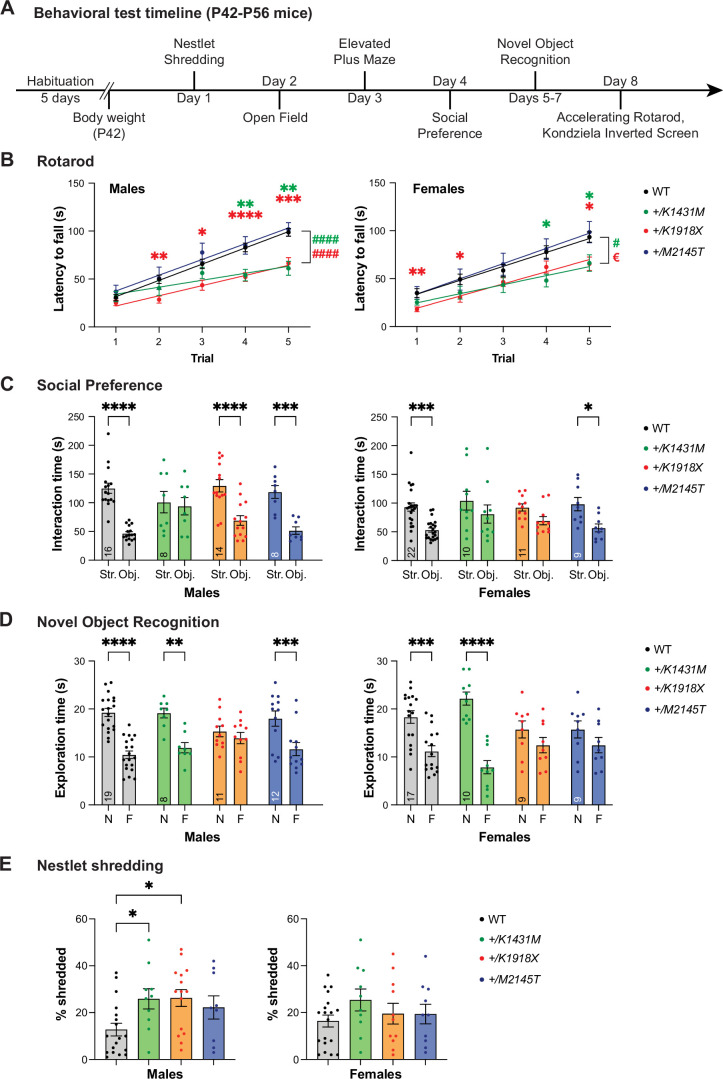
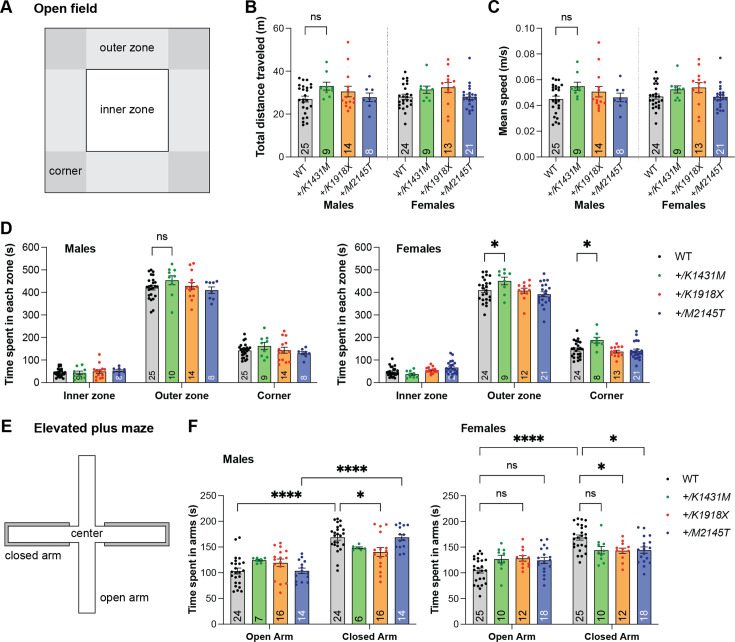
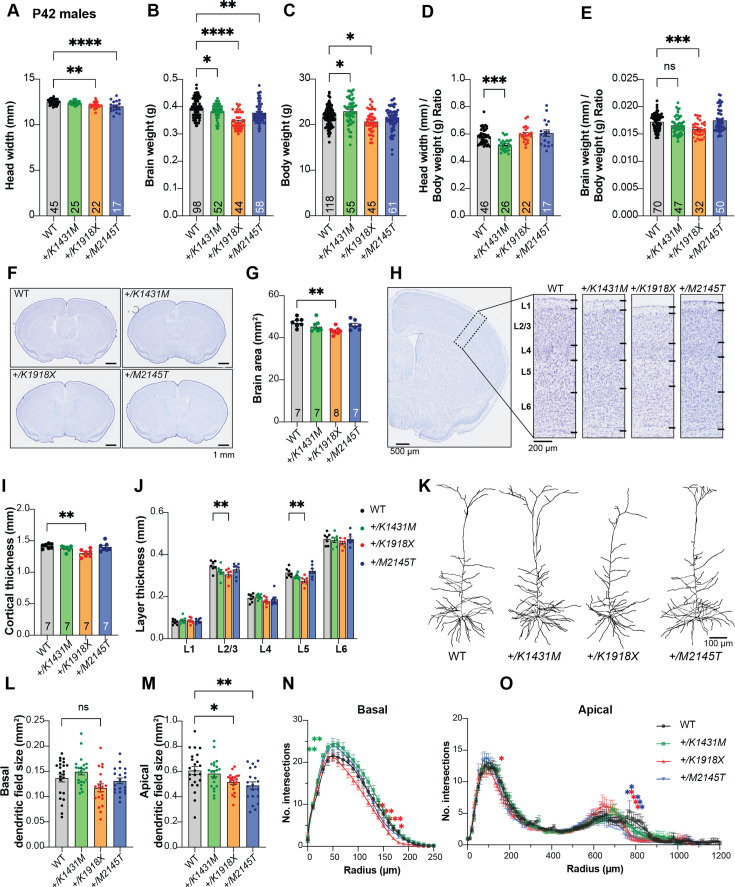
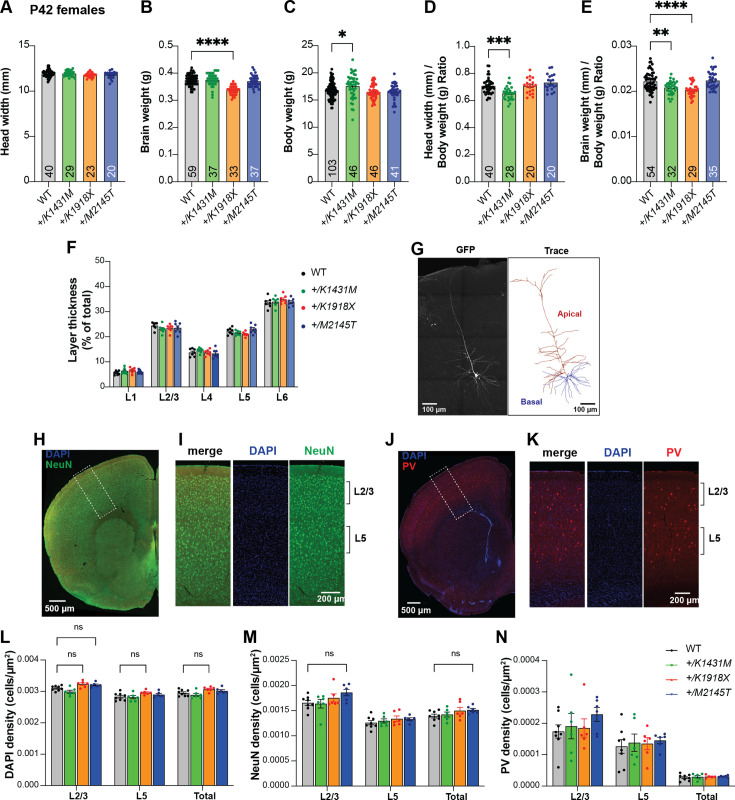
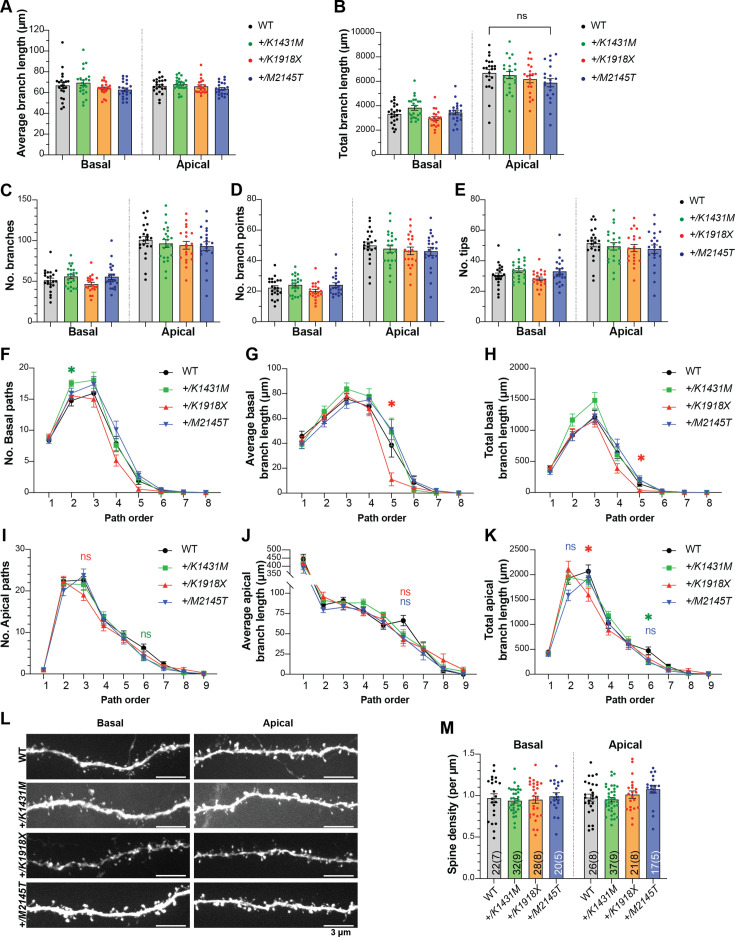
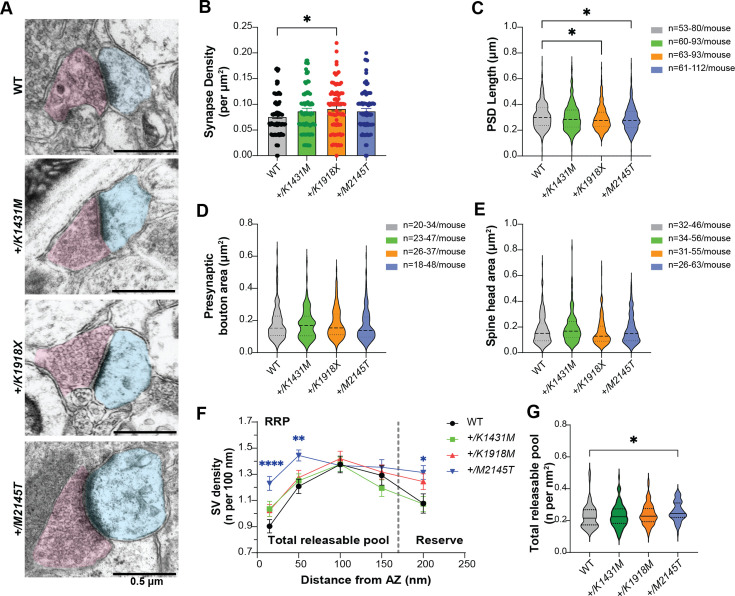
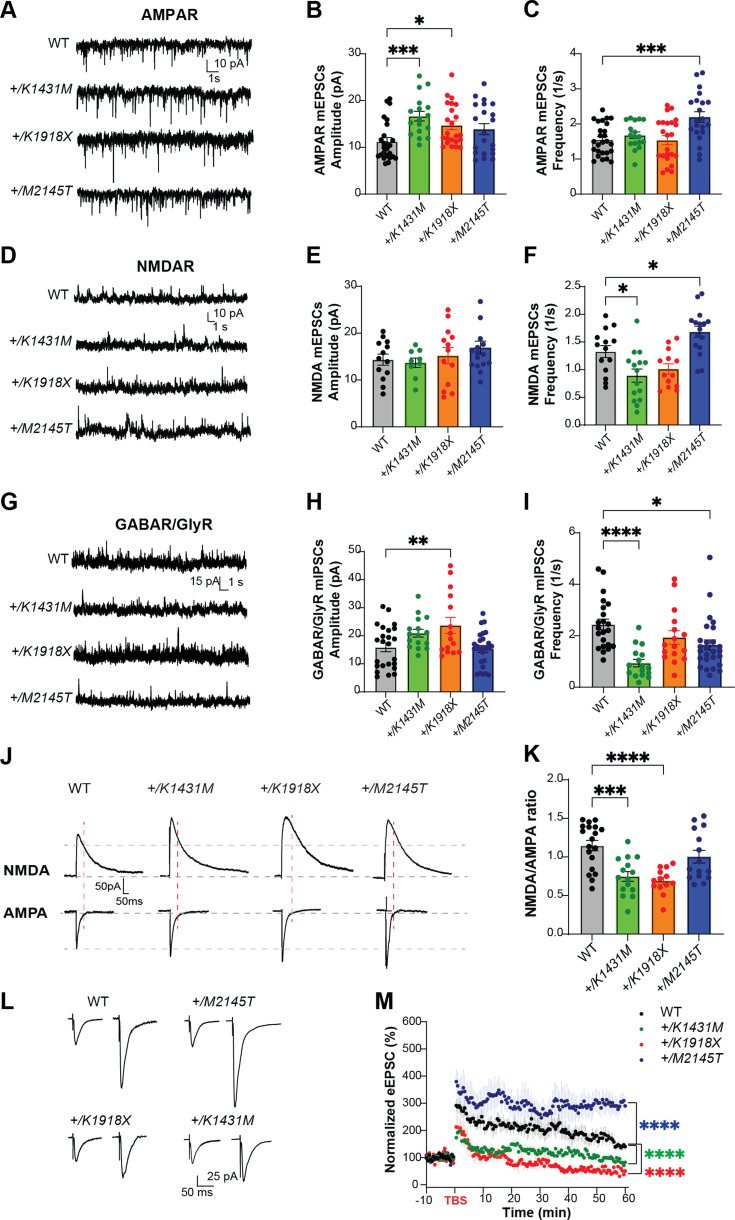
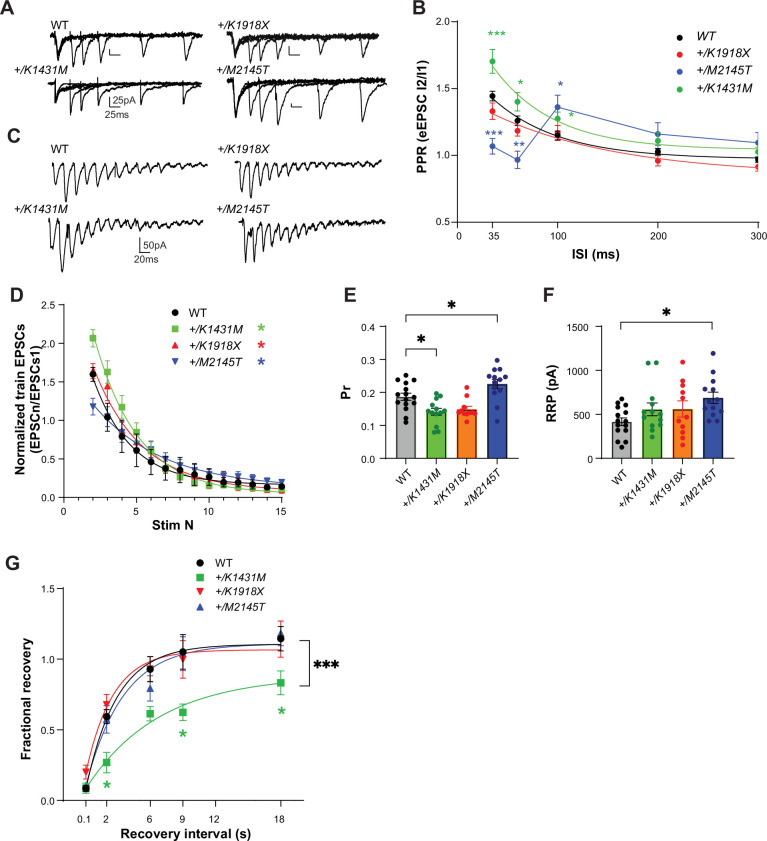
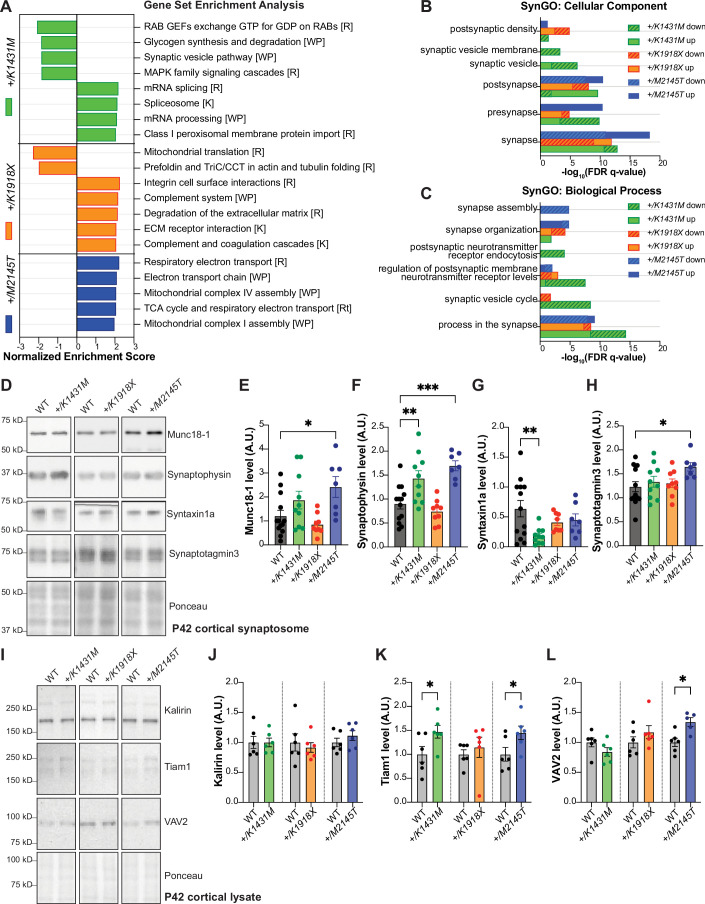
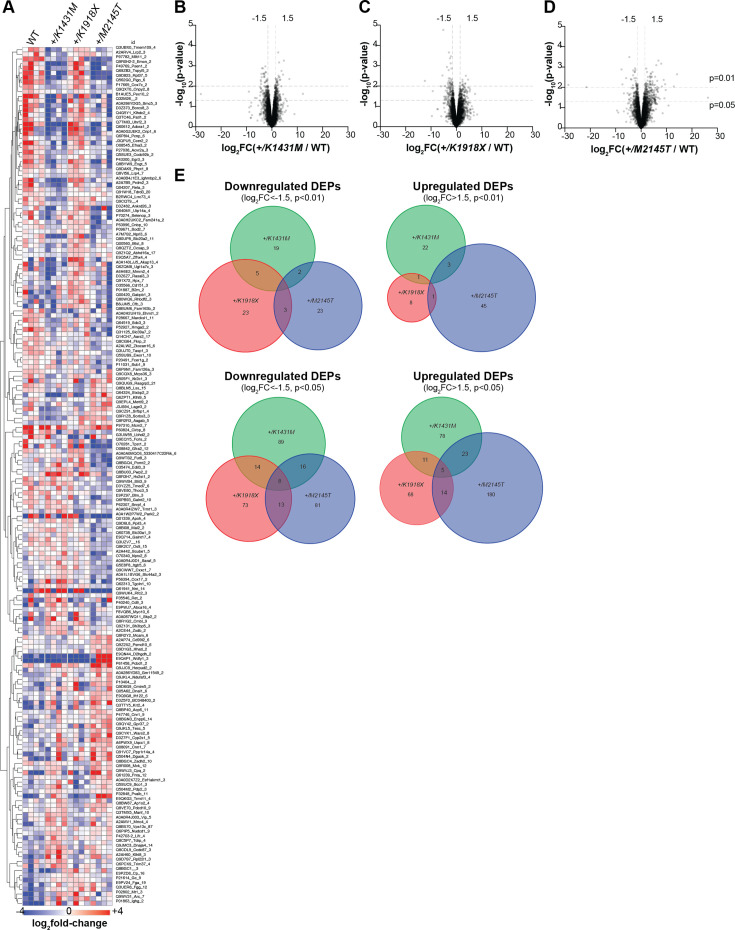
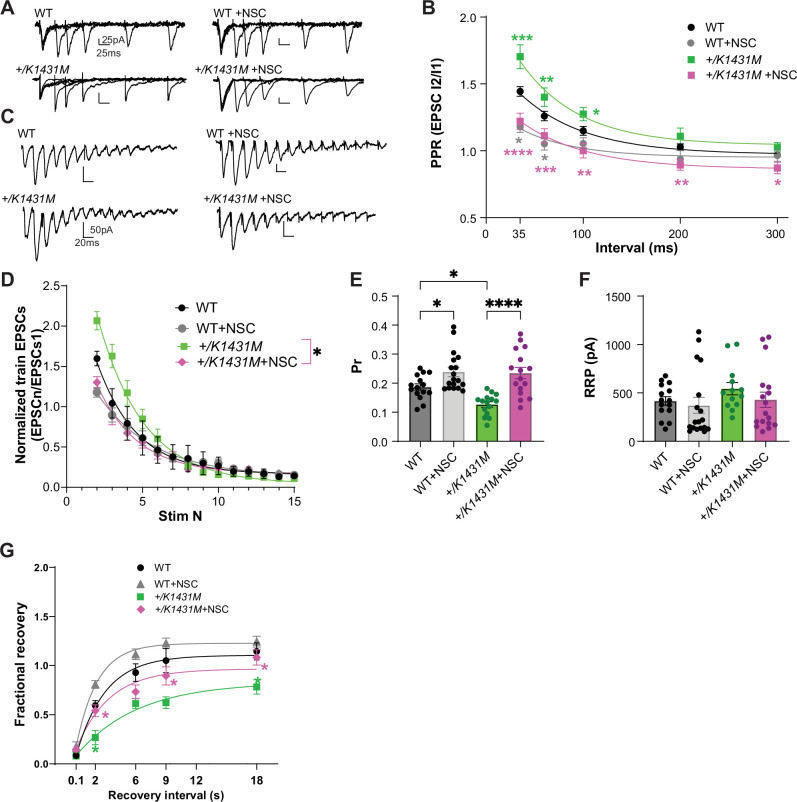
Genetic variants in TRIO are associated with neurodevelopmental disorders (NDDs) including schizophrenia (SCZ), autism spectrum disorder (ASD), and intellectual disability. TRIO uses its two guanine nucleotide exchange factor (GEF) domains to activate GTPases (GEF1: Rac1 and RhoG; GEF2: RhoA) that control neuronal development and connectivity. It remains unclear how discrete TRIO variants differentially impact these neurodevelopmental events. Here, we investigate how heterozygosity for NDD-associated Trio variants - +/K1431M (ASD), +/K1918X (SCZ), and +/M2145T (bipolar disorder, BPD) - impacts mouse behavior, brain development, and synapse structure and function. Heterozygosity for different Trio variants impacts motor, social, and cognitive behaviors in distinct ways that model clinical phenotypes in humans. Trio variants differentially impact head and brain size, with corresponding changes in dendritic arbors of motor cortex layer 5 pyramidal neurons (M1 L5 PNs). Although neuronal structure was only modestly altered in the Trio variant heterozygotes, we observe significant changes in synaptic function and plasticity. We also identified distinct changes in glutamate synaptic release in +/K1431M and +/M2145T cortico-cortical synapses. The TRIO K1431M GEF1 domain has impaired ability to promote GTP exchange on Rac1, but +/K1431M mice exhibit increased Rac1 activity, associated with increased levels of the Rac1 GEF Tiam1. Acute Rac1 inhibition with NSC23766 rescued glutamate release deficits in +/K1431M variant cortex. Our work reveals that discrete NDD-associated Trio variants yield overlapping but distinct phenotypes in mice, demonstrates an essential role for Trio in presynaptic glutamate release, and underscores the importance of studying the impact of variant heterozygosity in vivo.

Keywords: Neurodevelopmental disorders; Rac1; RhoA; TRIO; mouse; neuroscience; presynaptic.


Conflict of interest statement

YI, AJ, SF, TN, CM, KN, MC, MV, EC, CG, SM, AK No competing interests declared

Figures

Figure 1.
Figure 1.. Genetically engineered mice with heterozygosity for K1431M, K1918X, or M2145T Trio variants have divergent effects on Trio protein expression and Rho GTPase activity.
(A) Schematic of major Trio isoforms present in the adult mouse brain, with locations of engineered neurodevelopmental disease (NDD)-associated Trio variants: K1431M is a rare missense variant in the GEF1 DH domain associated with autism spectrum disorder (ASD); a K1918X nonsense variant that lies just before the GEF2 domain associated with schizophrenia (SCZ); and M2145T missense variant in the GEF2 DH domain found in an individual with bipolar disorder (BPD). (B) Representative sequencing chromatograms of WT and Trio variant mice. Arrows indicate heterozygosity for the variant alleles. (C) Representative immunoblots for Trio in P0 brain lysates using an antibody against Trio spectrin repeats (SR5-6). (D) Quantification of Trio protein levels from P0 brain lysates. Trio protein levels are reduced only in the brains of +/K1918X mice compared to WT controls (0.545±0.126 of WT level, p=0.0046). (E–H) Activity levels of Rac1 (E,G) and RhoA (F,H) in whole brain homogenates of neonate (P0, E–F) and adult (P42, G–H) Trio variant mice as measured by G-LISA assay. Rac1 activity is increased in +/K1431M mice relative to WT at both ages (1.106±0.027 fold at P0, p=0.0035; 1.509±0.175 fold at P42, p=0.0279) and decreased in neonate +/K1918X mice (0.908±0.0.032 fold, p=0.0230), with a trend towards increased activity in adult +/M2145T mice (1.438±0.183 fold, p=0.0843); meanwhile, RhoA activity appears unchanged in all mice relative to WT, although there may be a trend towards decreased activity in +/K1918X neonates (0.840±0.074 fold, p=0.1292). (I,J) Activity levels of Rac1 (I) and RhoA (J) in synaptosomes isolated from P42 mouse cortex. Rac1 activity is increased in +/K1431M synaptosomes (1.125±0.107 fold, p=0.0023), while RhoA activity is decreased in +/M2145T synaptosomes (0.731±0.042 fold, p=0.0093) relative to WT. All data shown as mean ± SEM. For (D–J), one-way ANOVA with post-hoc Bonferroni MC test identified differences from WT (nsp <0.1, *p<0.05, **p<0.01). Mouse numbers per group are shown in bars.
Figure 1—figure supplement 1.
Figure 1—figure supplement 1.. Trio +/K1918X but not +/K1431M or +/M2145T mice have reduced levels of Trio protein in the brain.
(A) In vitro GEF assay showing Rac1:Bodipy-FL-GDP exchange via fluorescence decay over time, with background subtracted and fitted with exponential curves. K1431M has impaired GEF activity compared to WT at equimolar amounts (500 nM) of TRIO GEF1 protein (n=3 replicates). (B) K1431M significantly decreases the initial rate of nucleotide exchange compared to WT (Kobs = 0.0006 ± 0.0002 x10⁻³ s–1 vs WT Kobs = 2.5 ± 0.1 x10⁻³ s–1; p<0.0001, n=3). (C) Number and frequency of progeny from heterozygote intercrosses. +/K1431M x +/K1431M crosses produced litters in the expected Mendelian frequencies of 25% +/+: 50% +/variant: 25% variant/variant (Chi-square test, two-tailed p=0.2231). +/K1918X (Chi-square test, two-tailed p<0.0001) intercrosses did not yield homozygote variants (binomial test, two-tailed p=0.0610). +/M2145T x +/M2145T crosses yielded slightly more heterozygotes than expected (Chi-square test, two-tailed p=0.0140). (D,H) Representative immunoblots for Trio isoforms in the cortex (D) and cerebellum (H) of P42 male Trio heterozygous variant and paired WT littermate mice (used antibodies noted in parentheses). (E–G,I–L) Quantification of Trio isoform levels in immunoblots of the cortex (E–G) and cerebellum (I–L). Significant decreases in Trio9 levels were found only in +/K1918X cortex (in E: 0.3590±0.06005 vs WT 1.000±0.1541, p=0.0036; in F: 0.3513±0.1191 vs WT 1.000±0.1165, p=0.0207) and cerebellum (in I: 0.4239±0.04858 vs WT 1.000±0.08361, p=0.0003; in J: 0.2753±0.08413 vs WT 1.000±0.2118, p=0.0059, n=6 mice per group). No significant changes in Trio levels were observed in +/K1431M or +/M2145T mouse brains. Trio8 levels in the cerebellum for all Trio heterozygous variant mice were unchanged from WT littermates. Ratio paired t-tests identified differences from the WT mean (n=6 mice per group). (M) Representative immunoblots showing enrichment of Trio, PSD95, and synaptophysin (Syp) in synaptosomes (syn) compared to 40 µm-filtered total homogenate (hom) from P42 WT mouse cortex. (N–P) Quantification of Trio9S, PSD95, and Syp in immunoblots from P42 mouse synaptosomes versus total homogenate (n=18 mice). All data are presented as mean ± SEM; significance tested by Paired t-tests unless specified otherwise (nsp <0.1, *p<0.05, **p<0.01, ****p<0.0001).
Figure 2.
Figure 2.. Heterozygosity for distinct Trio variants differentially impacts NDD-like mouse behaviors.
(A) Schematic illustration of the behavioral tests performed on young adult (P42–P56) heterozygous Trio variant mice of both sexes. All mice proceeded through the same battery of tests. (B) +/K1431M and +/K1918X mice of both sexes had decreased latency to fall off an accelerating rotarod compared to WT male mice. In male mice (left), linear regressions identified differences from WT in slopes, indicating impaired rate of improvement in the skill (WT 16.96±1.344; +/K1431M 7.270±2.019, p<0.0001; +/K1918X 10.61 ± 1.444, p<0.0001; ####p<0.0001) (n=40 WT; 10 +/K1431M; 16 +/K1918X; 13 +/M2145T male mice). In female mice (right), linear regressions identified differences from WT in slopes (+/K1431M 9.436±2.146, p=0.0215; vs WT 14.52±1.792; #p<0.05) and intercepts (+/K1918X 6.492 ± 5.555, p=0.0248; vs WT 19.28±5.942; p<0.05; n=28 WT; 11 +/K1431M; 16 13 +/K1918X; and 15 +/M2145T female mice). (C) +/K1431M mice of both sexes and +/K1918X females showed impaired social interactions in a three-chamber test, showing no preference to the (Str.) vs. inanimate object (Obj.) compared to WT. (D) +/K1918X mice of both sexes and +/M2145T females exhibit impaired novel object recognition and spend equal time exploring a novel object (N) and a familiar object (F). (E) Male +/K1918X mice exhibited increased nestlet shredding over 30 min (26.26 ± 3.61% shredded vs WT 14.26 ± 2.97%; p=0.0433), and +/K1431M mice exhibited a trend toward increased nestlet shredding (25.90 ± 4.34% shredded, p=0.1038) compared to WT mice. n=19 male, 19 female WT; 10 male, 10 female +/K1431M; 15 male, 11 female +/K1918X; 9 male, 10 female +/M2145T mice. All data are shown as mean ± SEM, significant differences identified using two-way ANOVA with post-hoc Bonferroni MC (nsp <0.1, *p<0.05, **p<0.01, ***p<0.001, ****p<0.0001). Numbers of mice quantified per group are annotated inside the bar unless otherwise indicated.
Figure 2—figure supplement 1.
Figure 2—figure supplement 1.. Heterozygosity for distinct Trio variants differentially impacts anxiety-like behaviors.
(A) Schematic diagram of the open field test. (B–F) Total distance and time in each zone were tracked automatically over 10 min per mouse (n of mouse per group are shown inside the bar). (B-C, D left) Trio variant male mice did not show significant differences in the open field test compared to WT. (D right) +/K1431M females spent significantly more time in the outer and corner zones of the open field relative to WT females (outer zone: +/K1431M 450.622±17.117 s, vs WT 409.774±10.664 s zone, p=0.0157; corner zone: +/K1431M 188.188±12.876 s, vs WT 146.550±7.251 s, p=0.0192). (E) Schematic diagram of the elevated plus maze. (F) WT mice of both sexes and +/M2145T males preferred to spend more time in the closed arms than in the open arms of the elevated plus maze; +/K1431M and +/K1918X mice of both sexes and +/M2145T females in time spent in open versus closed arms in the elevated plus maze test. Females of all Trio heterozygote genotypes as well as +/K1918X males displayed decreased time in the closed arm relative to WT mice and exhibited trends towards increased time in the open arms relative to WT. All data are presented as mean ± SEM. Two-way ANOVA with post-hoc Bonferroni MC test identified differences from WT (nsp <0.1, *p<0.05, ****p<0.0001). Numbers of mice quantified per group are annotated inside the bars.
Figure 3.
Figure 3.. Trio +/K1431M and +/K1918X mice have smaller brain weights, but only +/K1918X brains have smaller, less complex neurons.
(A) Ear-to-ear head width is reduced in P42 +/K1918X and +/M2145T compared to WT male mice (+/K1431M: 12.40±0.04 mm, p=0.95; +/K1918X: 12.15±0.08, p=0.001; +/M2145T 12.01±0.15, p<0.0001; vs WT 12.49±0.04 mm, n=17–45). (B) Brain weight is significantly decreased relative to WT in P42 males of all three heterozygous Trio variants (+/K1431M: 0.382±0.004 g, p=0.04; +/K1918X: 0.346±0.004 g, p<0.0001; +/M2145T 0.378±0.005 g, p=0.002; vs WT 0.396±0.004 g, n=44–98). (C) Body weight is significantly increased in P42 +/K1431M males and decreased in +/K1918X males (+/K1431M: 22.91±0.38 g, p=0.01; +/K1918X: 20.67±0.03 g, p=0.001; +/M2145T: 21.22±0.33 g, p=0.44; vs WT 21.76±0.19 g, n=45–118). (D) Head widths normalized to body weight of P42 +/K1431M male mice were reduced 10.8% compared to WT mice (+/K1431M: 0.520±0.008 mm/g, p=0.0001; +/K1918X: 0.598±0.012 mm/g, p>0.999; +/M2145T 0.607±0.023 mm/g, p=0.54; vs WT 21.76±0.19 mm/g, n=17–46). (E) Brain weights normalized to body weight of P42 +/K1431M and +/K1918X male mice were reduced 3.9% and 7.9%, respectively compared to WT mice (+/K1431M: 0.520±0.008 mm/g, p=0.0001; +/K1918X: 0.598±0.012 mm/g, p>0.999; +/M2145T 0.607±0.023 mm/g, p=0.54; vs WT 21.76±0.19 mm/g, n=17–46). (F) Representative images of Nissl-stained 30 μm coronal slices of male P42 WT and heterozygous Trio variant brains. (G) Total cross-sectional tissue area of Nissl-stained coronal sections was reduced by ~9% + /K1918X in P42 male mice compared to WT. (H) Representative images of Nissl-stained cortical layers (L1-L6, dotted black box) of P42 WT and heterozygous Trio variant brains. (I) The total cortical thickness (from H) is reduced by ~8% in +/K1918X P42 male brains compared to WT. (J) Thickness of individual cortical layers, as identified in Nissl stains in H. L2/3 and L5 were preferentially reduced (–12% and –13%, resp.) in +/K1918X cortex relative to WT (L2/3: 0.306±0.011 mm vs WT 0.346±0.010 mm, p=0.0043; L5: 0.274±0.008 mm vs WT 0.314±0.008 mm, p=0.0054). (K) Representative traces of M1 L5 PNs from heterozygous male Trio variant mice crossed with Thy1-GFP(M). (L) +/K1918X M1 L5 PNs show a trend toward reduced basal dendritic field size (0.1172±0.0078 mm²; vs WT 0.1368±0.0077 mm², p=0.0933; n=15–22 neurons per mouse), as measured by convex hull analysis of dendrite arbor reconstructions. (M) Both +/K1918X and +/M2145T exhibit significantly smaller apical dendritic field size (+/K1918X: 0.5157±0.0169 mm², p=0.0460; +/M2145T: 0.4893±0.0285 mm², p=0.0062) compared to WT (0.6081±0.0319 mm²; n=15–22 neurons per mouse). All data shown as mean ± SEM. One-way ANOVA with post-hoc Bonferroni MC test identified significant differences from WT (nsp <0.1, *p<0.05, **p<0.01). (N,O) Sholl analysis revealed basal (N) and apical (O) dendritic arborization changes in Trio variant M1 L5 PNs compared to WT: both basal and apical arborization was reduced in +/K1918X, while proximal basal arborization was increased in +/K1431M. Two-way ANOVA (stacked) with post-hoc Bonferroni MC test identified differences from WT.
Figure 3—figure supplement 1.
Figure 3—figure supplement 1.. Heterozygous Trio variant mice show mild alterations in cortical organization.
(A) Ear-to-ear head width is unchanged from WT for all female heterozygous Trio variant mice at P42. (B) Brain weight is significantly reduced by 9.9% in P42 +/K1918X female mice compared to WT. (C) Body weight is increased by 4.2% in P42 +/K1431M female mice. (D) Head widths normalized to body weight of P42 +/K1431M female mice were reduced by 7.9% compared to WT mice. Head width-to-body weight ratios were calculated per individual mouse, with mouse number per group annotated within the bar. (E) Brain weights normalized to body weight of P42 +/K1431M and +/K1918X female mice were reduced 6.2% and 8.6%, respectively, compared to WT mice. Brain-to-body weight ratios were calculated per individual mouse, with mouse number per group annotated within the bar. (F) Thickness of individual cortical layers expressed as a percentage of total cortical thickness. No differences were observed in Trio variant mice compared to WT. For (G–H), two-way ANOVA with post-hoc Bonferroni MC test identified differences from WT (**P<0.01; n=7 mice per group). (G) Representative maximum projection fluorescence image and corresponding dendritic arbor reconstruction of a motor cortex Layer 5 pyramidal neuron (M1 L5 PN) from a P42 Thy1-GFP mouse. (H–K) Representative fluorescent image of a 30 μm coronal slice from P42 WT brain, immunostained for NeuN and PV. Regions of motor cortex as outlined by the white dotted box in (H) and (J) are magnified in (I) and (K), resp. (L–N) Density of DAPI+, NeuN+, and PV + cells did not significantly differ between Trio variants and WT in the total M1 region quantified or in cortical layers 2/3 and 5, though there were trends towards increased DAPI + cell density in +/K1918X and increased L2/3 NeuN + cell density in +/M2145T P42 male mice relative to WT. All data are shown as mean ± SEM; significance tested by one-way or two-way ANOVA with post-hoc Bonferroni MC test identified differences from WT (ns: 0.05<p < 0.1; n=6 mice for Trio variants, n=8 WT mice; 3 slices per mouse were analyzed). All data are presented as mean ± SEM.
Figure 3—figure supplement 2.
Figure 3—figure supplement 2.. Additional measurements of dendrites from M1 L5 PN reconstructions show modest order-dependent changes in Trio variant mice.
(A–E) Overall measurements of dendritic reconstructions showed that average dendrite length (A), sum total dendrite length (B), number of branches (C), number of branch points (D), and number of tips (E) of Trio variant M1 L5 PNs were not different from WT. (n=same as in main Figure 2J–M). (F–K) Path length analysis showed dendrite order-dependent changes in +/K1431M and +/K1918X number of branches (F,I), average dendrite length (G,J), sum total dendrite length (H,K) for basal (F–H) and apical (I–K) dendrites compared to WT. +/K1918X PNs exhibited reduced average and total dendrite length at higher-order basal dendrites (in 5th-order basal dendrites: average branch length 11.015±5.176 µm vs WT 38.51±9.565 µm, p=0.0491; total dendrite length 31.593±18.700 µm vs WT 137.550±38.407 µm, p=0.0491) and reduced sum total branch length in mid-order apical dendrites (in tertiary apical dendrites, 1596.476±129.408 vs WT 2068.017 ±127.918 µm, p=0.0354). +/K1431 PNs had increased proximal basal dendrite numbers (in secondary basal dendrites, 17.545±0.513 µm vs WT 14.783±0.866 µm, p=0.0256). Two-way ANOVA with post-hoc Bonferroni MC test identified differences from WT. (L) Representative maximum projection fluorescence images of basal and apical dendrite segments from M1 L5 PNs of P42 Trio variant mice. (M) Dendritic spine density on proximal apical and secondary basal dendrites is unchanged in Trio variant mice compared to WT (used 2–5 dendrites per neuron/1–2 neurons per mouse). Numbers of dendrites quantified per group are annotated inside the bar (number of neurons in parentheses). All data show mean ± SEM; significance tested using one-way or two-way ANOVA as appropriate with post-hoc Bonferroni MC test identified differences from WT (nsp <0.1, *p<0.05, **p<0.01; n=same as in main Figure 2J–M).
Figure 4.
Figure 4.. Trio variants differentially impact synapse ultrastructure and synaptic vesicle distribution.
(A) Representative electron micrographs (EMs) from motor cortex layer 5 (M1 L5) of P42 WT and Trio variant mice. Post-synaptic regions are pseudo-colored in cyan; pre-synaptic regions in magenta. (B) Asymmetric synapse density was increased in +/K1918X mice (0.09205±0.004775 synapses/µm2; vs WT 0.07633±0.003954 synapses/µm2, p=0.0345). (C) PSD lengths were slightly decreased in M1 L5 synapses by 6% in +/K1918X and 6.6% in +/M2145T mice vs WT (+/K1918X 0.2926 ± 0.004652 µm, p=0.0204; +/M2145T 0.2916±0.004922 µm, p=0.0142; vs WT 0.3125±0.005612 µm). (D,E) Presynaptic bouton and spine head areas of Trio variants M1 L5 synapses were unchanged from WT. (F) Synaptic vesicles (SVs) distribution per 100 nm of active zone (AZ) length in M1 L5 as a function of distance from the AZ. +/M2145T showed an increase in readily releasable pool (RRP) identified as docked SVs (15 nm from AZ; 1.23±0.05 vs WT 0.90±0.05) and increase in tethered SVs (50 nm from AZ; 1.44±0.04 vs WT 1.20±0.05). +/K1918X and +/M2145T also showed an increase in the reserve pool of SVs (200 nm from AZ; 3.51±0.21 and 3.81±0.18, resp. vs WT 2.74±0.16, n=15–30 synapses/mouse). (G) Total releasable pool, calculated as number of SVs at 15–150 nm from AZ per area of distribution (nm2). RRP (15–50 nm from AZ) was significantly increased in +/M2145T (0.257±0.007 vs WT 0.228±0.008), driven by increased docked and tethered SVs. All data are presented as mean ± SEM, significance tested by ordinary one-way ANOVA with post-hoc Bonferroni MC test (*p<0.05, **p<0.01, ***p<0.001, ****p<0.0001).
Figure 5.
Figure 5.. Trio variant mice exhibit deficits in synaptic signaling and LTP.
(A,D) Representative traces of miniature excitatory AMPAR-mediated mEPSCs, NMDAR-mediated mEPSCs, and (G) inhibitory postsynaptic currents (mIPSCs) in M1 L5 pyramidal neurons of WT and Trio variant mice. (B) AMPAR-mediated mEPSC amplitudes were significantly increased in +/K1431M (16.67±1.04 pA; p=0.0009) and +/K1918X (14.71±0.92 pA; p=0.03) slices, with no observed changes in +/M2145T slices (13.90±1.16 pA; p=0.16) compared to WT (11.25±0.84 pA; n=17–25 neurons from ≥6–8 mice per group). (C) No significant changes in AMPAR mEPSC frequencies (q) were observed in +/K1431M and +/K1918X, while +/M2145T had an increase (2.20±0.15 1 /s; vs WT 1.55±0.09 1 /s; p=0.0005). (E, F) NMDAR mEPSC frequencies were reduced in +/K1431M (0.89±0.12 1 /s; vs WT 1.3324±0.11 1 /s; p=0.015) and showed an increase in +/M2145T mice (1.68±0.10 1 /s vs WT 1.3324±0.11 1 /s; p=0.044, n=9–13 neurons from ≥5–7 mice per group). (H, I) GABA/GlyR mIPSC amplitudes were significantly increased in +/K1918X vs WT (23.69±2.89 pA; vs 15.86±1.56 pA, respectably; p=0.008), while frequency was decreased in +/K1431M and +/M2145T (0.94±0.14 1 /s, p<0.0001; and 1.64±0.19 1 /s, p=0.013; respectably; vs WT 2.44±0.20; n=16–26 neurons from ≥6–8 mice per group). (J) Representative averaged traces of NMDA and AMPA eEPSCs recorded in M1 L5 PNs. (K) Heterozygous +/K1431M and +/K1918X Trio variants mice display reduced NMDAR/AMPAR eEPSC amplitude ratios, suggesting an increase in AMPAR transmission in M1 L5 PNs (+/K1431M: 0.75±0.06, p=0.0002; +/K1918X: 0.69±0.05, p<0.0001; +/M2145T: 1.00±0.08, p=0.37; vs WT: 1.15±0.07; n=13–19 neurons from ≥5–6 mice per group). (L) Averaged representative traces of baseline and post-TBS eEPSC currents in M1 L5 PNs of WT and Trio variant mice. (M) Normalized eEPSC amplitudes measuring LTP in L5 PNs by TBS in L2/3 afferents in all genotypes showed a significant decrease in the initiation and no potentiation of the LTP in +/K1431M and +/K1918X, with increase in initiation and potentiation of +/M2145T M1 L5 PNs compared to WT. LTP was induced at 0 min. RM two-way ANOVA with post-hoc Bonferroni MC test identified significant differences (n=6–8 neurons from ≥4–5 mice per group). Data are presented as mean ± SEM; significance tested by one-way ANOVA with post-hoc Bonferroni test unless specified otherwise (**p<0.01; ***p<0.001; ****p<0.0001).
Figure 6.
Figure 6.. Trio +/K1431M and +/M2145T variant mice have deficiencies in short-term facilitation, glutamate Pr, and RRP.
(A) Representative traces in M1 L5 PNs of WT, Trio variant mice in response to paired pulse stimulation in L2/3. (B) Paired-pulse ratio (PPR) at varying interstimulus intervals (ISIs) was overlaid with a single exponential fit (except for +/M2145T data). An increase in the initial PPR was observed in M1 L5 PNs of +/K1431M slices (35ms: 1.70±0.089, p=0.003; 60ms: 1.40±0.07, p=0.046; 100ms: 1.27±0.05, p=0.031; n=20–34 neurons from ≥7–9 mice per group) with no change in +/K1918X slices; and in +/M2145T slices we observed a decrease in initial RRP at shorter ISIs (35ms: 1.05±0.06, p<0.0001; 60ms: 0.97±0.06, p=0.037) and an increase at longer ISIs (100ms: 1.36±0.09, p=0.034; 200ms: 1.18±0.08, p=0.013) compared to WT (35ms: 1.40±0.04; 60ms: 1.21±0.03; 100ms: 1.13±0.03; 200ms 1.0±0.02; 300ms 0.96±0.17). (C) Representative traces of AMPAR eEPSCs in M1 L5 PNs under HFS (15 pulses at 40 Hz) in L2/3. (D) AMPAR eEPSCn amplitudes normalized to eEPSC1 of the train revealed changes in the depletion rates during HFS in Trio +/K1431M and +/M2145T variants compared to WT (tau decay (τd), WT: 2.7 s, +/K1431M: 3.19 s, +/M2145T: 4.79 s, +/K1918X: 2.52 s; n=12–15 neurons from 5 to 7 mice). (E) The estimated glutamate probability of release (Pr) was decreased in +/K1431M slices (0.13±0.099; p=0.013) and increased in +/M2145T slices (0.26±0.019, p=0.042), with no significant change in +/K1918X slices (0.15±0.01, p=0.64) compared to WT M1 L5 PNs (0.19±0.01; n=12–15 neurons from ≥5 mice per group). (F) The calculated size of the readily releasable vesicle pool (RRP) was increased only in +/M2145T M1 L5 PNs compared to WT (665.7±68.5 pA vs 415.8±43.9 pA, p=0.012). RRP in +/K1431M and +/K1918X synapses did not differ from WT (543.1±64.4 pA; and 543.1±64.4 pA, respectively vs 415.8±43.9 pA) (G) Exponential fits of the fractional recovery plotted vs ISI, to estimate synapse ability to recover from RRP depletion. Time of recovery, measured by exponential tau recovery (τR), was significantly decreased in +/K1431M M1 L5 PNs (5.7 s, vs WT 2.2 s). +/K1431M also exhibited an inability to fully recover to initial levels after ISI 18 s, vs WT. Data are presented as mean ± SEM, with significant differences from WT tested using one-way ANOVA with post-hoc Bonferroni (*p<0.05; **p<0.01; ***p<0.001; ****p<0.0001).
Figure 7.
Figure 7.. Trio variant mice show different molecular changes in the cortex involving presynaptic machinery and Rac1 GEFs.
(A) Bar graph illustrating the top enriched pathways (FDR q-value <0.2, *FDR <0.05) identified by gene set enrichment analysis (GSEA) for each Trio mutant mouse compared to WT, using all 7,362 proteins quantified by mass spectrometry in P21 cortex (n=4/genotype), sorted by normalized enrichment score (NES). Pathways with +NES are upregulated, -NES are downregulated vs. WT. [ ] indicates gene set: [R] Reactome, [WP] WikiPathways, [K] KEGG. Full list attached in Figure 7—source data 1. (B, C) Bar graphs illustrating the top enriched (FDR q-value <0.001) (B) cellular components and (C) biological processes identified by GSEA, using synaptic proteins from SynGO gene sets (n=1,077 proteins), full list see in Figure 7—source data 2. (D) Representative immunoblots in synaptosomes isolated from P42 cortex of WT and Trio variant mice. (E–H) Normalized intensity levels from immunoblots demonstrate significant increases of (E) Munc18-1 (also known as syntaxin binding protein 1), (F) synaptophysin (Syp), (G) syntaxin1a (Stx1) and (H) synaptotagmin3 (Syt3) levels in +/M2145T synaptosomes; Syp is increased while Stx1a is significantly decreased in +/K1431M synaptosomes compared to WT. Ordinary one-way ANOVA with post-hoc Bonferonni MC test identified differences from WT (*p<0.05, **p<0.01, ***p<0.001; n=synaptosomes from 7 to 14 male mice). (I) Representative immunoblots of select RhoGEFs from P42 cortical lysates of WT and Trio variant mice. (J–L) Normalized intensity levels from immunoblots identified ~47% increase of Tiam1 levels in +/K1431M and increase ~45% in +/M2145T cortex vs to WT; VAV2 is increased by ~34% in +/M2145T cortex compared to WT. Unpaired t-tests identified differences from WT (*p<0.05; n=6 mice per genotype).
Figure 7—figure supplement 1.
Figure 7—figure supplement 1.. Mass spectrometry-based proteomics reveals molecular changes in the brains of Trio variant mice compared to WT mice.
(A) Heatmap of select protein abundances in P21 cortex of WT and Trio variant mice shows genotype differences. Each row is a protein, each column a mouse (n=4 mice per genotype). Displayed are 184/7362 proteins with significant differences (p<0.01, t-test). Red = upregulated, blue = downregulated, sorted by k-means clustering. Complete list of proteins shown in Figure 7—figure supplement 1—source data 1. (B–D) Volcano plots of differentially expressed proteins (DEPs) identified by proteomics for P21 +/K1431M (B), +/K1918X (C), and +/M2145T (D) mice, expressed as log2(fold-change, FC) relative to WT mice (from n=4 mice per genotype). DEPs that are increased in the mutant compared to WT have a positive log2FC, while DEPs that are decreased in the mutant compared to WT have a negative log2FC. Dotted lines on y-axis indicate cutoffs of p<0.01 and p<0.05; dotted lines on x-axis indicate cutoffs of log2FC <−1.5 (downregulated DEPs) or log2FC >1.5 (upregulated DEPs). (E) Venn diagrams show little overlap in the up- and down-regulated DEPs between Trio variant mice, using DEP cut-off values of log2FC >1.5 (upregulated DEPs) or log2FC <−1.5 (downregulated DEPs), and p<0.01 or p<0.05.
Figure 8.
Figure 8.. NSC, Rac1 inhibitor application rescued Pr in +/K1431M L23-L5 synapses and improved SV recycling.
(A) Representative PPR traces of WT and Trio +/K1431M slices with or without 5 min application of 100 µM NSC23766. (B) Acute application of NSC onto both +/K1431M and WT synapses leads to a decrease in PPF in M1 L2/3-L5 synapses. +/K1431M slices significantly shifted the PPF curve at all ISI downwards compared to untreated +/K1431M slices and showed no significant difference from WT (+/K1431M+NSC 35ms: 1.25±0.06, p<0.0001; 60ms: 1.13±0.052, p=0.0007; 100ms: 1.02±0.053, p=0.0017; 200ms 0.91±0.039, p=0.0043; 300ms 0.88±0.045, p=0.021), with +/K1431M shifting into paired pulse depression at 200–300ms intervals, while WT PPF plateauing to 1. (C) Representative traces of AMPAR eEPSCs in M1 L5 PNs under HFS of WT and Trio +/K1431M slices before and after NSC application. (D) Normalized AMPAR eEPSCn amplitudes of the train revealed changes in the depletion rates during HFS before and after NSC application to WT and +/K1431M slices (tau decay (τd), WT +NSC: 2.85 s vs WT: 2.70 s; +/K1431M+NSC: 2.66 s vs +/K1431M: 3.19 s, n=12–15 neurons from 5 to 7 mice). (E) Rac1 inhibition by NSC increased the glutamate Pr in both WT and +/K1431M slices (WT +NSC 0.25±0.067 vs initial 0.19±0.01, p=0.046; and for +/K1431M+NSC 0.23±0.019 vs initial 0.13±0.099, p<0.0001; n=15–18 neurons from ≥5 mice per group). (F) RRP in WT or +/K1431M synapses with NSC did not show significant changes to initial values (WT +NSC: 370.3±82.37 pA vs 415.8±43.9 pA, p˃0.99; +/K1431M+NSC: 427.9±79.2 vs 543.1±64.44 pA, p˃0.99). (G) Exponential fits of the fractional recovery for WT and +/K1431M with and without NSC application. NSC application led to a faster recovery time in WT (+NSC: 1.5 s vs initial 2.2 s) and it significantly improved but did not fully rescue recovery time in +/K1431M (+NSC 3.2 s vs initial 5.7 s), but allowed for full recovery at 18 s. Data are presented as mean ± SEM, significance tested using one-way ANOVA with post-hoc Bonferroni (*p<0.05; **p<0.01; ***p<0.001; ****p<0.0001).

Update of

Similar articles

Cited by

References

    1. American Psychiatric Association . Diagnostic and Statistical Manual of Mental Disorders. American Psychiatric Association; 2013.
    1. Anttila V, Bulik-Sullivan B, Finucane HK, Walters RK, Bras J, Duncan L, Escott-Price V, Falcone GJ, Gormley P, Malik R, Patsopoulos NA, Ripke S, Wei Z, Yu D, Lee PH, Turley P, Grenier-Boley B, Chouraki V, Kamatani Y, Berr C, Letenneur L, Hannequin D, Amouyel P, Boland A, Deleuze J-F, Duron E, Vardarajan BN, Reitz C, Goate AM, Huentelman MJ, Kamboh MI, Larson EB, Rogaeva E, St George-Hyslop P, Hakonarson H, Kukull WA, Farrer LA, Barnes LL, Beach TG, Demirci FY, Head E, Hulette CM, Jicha GA, Kauwe JSK, Kaye JA, Leverenz JB, Levey AI, Lieberman AP, Pankratz VS, Poon WW, Quinn JF, Saykin AJ, Schneider LS, Smith AG, Sonnen JA, Stern RA, Van Deerlin VM, Van Eldik LJ, Harold D, Russo G, Rubinsztein DC, Bayer A, Tsolaki M, Proitsi P, Fox NC, Hampel H, Owen MJ, Mead S, Passmore P, Morgan K, Nöthen MM, Rossor M, Lupton MK, Hoffmann P, Kornhuber J, Lawlor B, McQuillin A, Al-Chalabi A, Bis JC, Ruiz A, Boada M, Seshadri S, Beiser A, Rice K, van der Lee SJ, De Jager PL, Geschwind DH, Riemenschneider M, Riedel-Heller S, Rotter JI, Ransmayr G, Hyman BT, Cruchaga C, Alegret M, Winsvold B, Palta P, Farh K-H, Cuenca-Leon E, Furlotte N, Kurth T, Ligthart L, Terwindt GM, Freilinger T, Ran C, Gordon SD, Borck G, Adams HHH, Lehtimäki T, Wedenoja J, Buring JE, Schürks M, Hrafnsdottir M, Hottenga J-J, Penninx B, Artto V, Kaunisto M, Vepsäläinen S, Martin NG, Montgomery GW, Kurki MI, Hämäläinen E, Huang H, Huang J, Sandor C, Webber C, Muller-Myhsok B, Schreiber S, Salomaa V, Loehrer E, Göbel H, Macaya A, Pozo-Rosich P, Hansen T, Werge T, Kaprio J, Metspalu A, Kubisch C, Ferrari MD, Belin AC, van den Maagdenberg AMJM, Zwart J-A, Boomsma D, Eriksson N, Olesen J, Chasman DI, Nyholt DR, Avbersek A, Baum L, Berkovic S, Bradfield J, Buono RJ, Catarino CB, Cossette P, De Jonghe P, Depondt C, Dlugos D, Ferraro TN, French J, Hjalgrim H, Jamnadas-Khoda J, Kälviäinen R, Kunz WS, Lerche H, Leu C, Lindhout D, Lo W, Lowenstein D, McCormack M, Møller RS, Molloy A, Ng P-W, Oliver K, Privitera M, Radtke R, Ruppert A-K, Sander T, Schachter S, Schankin C, Scheffer I, Schoch S, Sisodiya SM, Smith P, Sperling M, Striano P, Surges R, Thomas GN, Visscher F, Whelan CD, Zara F, Heinzen EL, Marson A, Becker F, Stroink H, Zimprich F, Gasser T, Gibbs R, Heutink P, Martinez M, Morris HR, Sharma M, Ryten M, Mok KY, Pulit S, Bevan S, Holliday E, Attia J, Battey T, Boncoraglio G, Thijs V, Chen W-M, Mitchell B, Rothwell P, Sharma P, Sudlow C, Vicente A, Markus H, Kourkoulis C, Pera J, Raffeld M, Silliman S, Boraska Perica V, Thornton LM, Huckins LM, William Rayner N, Lewis CM, Gratacos M, Rybakowski F, Keski-Rahkonen A, Raevuori A, Hudson JI, Reichborn-Kjennerud T, Monteleone P, Karwautz A, Mannik K, Baker JH, O’Toole JK, Trace SE, Davis OSP, Helder SG, Ehrlich S, Herpertz-Dahlmann B, Danner UN, van Elburg AA, Clementi M, Forzan M, Docampo E, Lissowska J, Hauser J, Tortorella A, Maj M, Gonidakis F, Tziouvas K, Papezova H, Yilmaz Z, Wagner G, Cohen-Woods S, Herms S, Julià A, Rabionet R, Dick DM, Ripatti S, Andreassen OA, Espeseth T, Lundervold AJ, Steen VM, Pinto D, Scherer SW, Aschauer H, Schosser A, Alfredsson L, Padyukov L, Halmi KA, Mitchell J, Strober M, Bergen AW, Kaye W, Szatkiewicz JP, Cormand B, Ramos-Quiroga JA, Sánchez-Mora C, Ribasés M, Casas M, Hervas A, Arranz MJ, Haavik J, Zayats T, Johansson S, Williams N, Dempfle A, Rothenberger A, Kuntsi J, Oades RD, Banaschewski T, Franke B, Buitelaar JK, Arias Vasquez A, Doyle AE, Reif A, Lesch K-P, Freitag C, Rivero O, Palmason H, Romanos M, Langley K, Rietschel M, Witt SH, Dalsgaard S, Børglum AD, Waldman I, Wilmot B, Molly N, Bau CHD, Crosbie J, Schachar R, Loo SK, McGough JJ, Grevet EH, Medland SE, Robinson E, Weiss LA, Bacchelli E, Bailey A, Bal V, Battaglia A, Betancur C, Bolton P, Cantor R, Celestino-Soper P, Dawson G, De Rubeis S, Duque F, Green A, Klauck SM, Leboyer M, Levitt P, Maestrini E, Mane S, De-Luca DM, Parr J, Regan R, Reichenberg A, Sandin S, Vorstman J, Wassink T, Wijsman E, Cook E, Santangelo S, Delorme R, Rogé B, Magalhaes T, Arking D, Schulze TG, Thompson RC, Strohmaier J, Matthews K, Melle I, Morris D, Blackwood D, McIntosh A, Bergen SE, Schalling M, Jamain S, Maaser A, Fischer SB, Reinbold CS, Fullerton JM, Guzman-Parra J, Mayoral F, Schofield PR, Cichon S, Mühleisen TW, Degenhardt F, Schumacher J, Bauer M, Mitchell PB, Gershon ES, Rice J, Potash JB, Zandi PP, Craddock N, Ferrier IN, Alda M, Rouleau GA, Turecki G, Ophoff R, Pato C, Anjorin A, Stahl E, Leber M, Czerski PM, Cruceanu C, Jones IR, Posthuma D, Andlauer TFM, Forstner AJ, Streit F, Baune BT, Air T, Sinnamon G, Wray NR, MacIntyre DJ, Porteous D, Homuth G, Rivera M, Grove J, Middeldorp CM, Hickie I, Pergadia M, Mehta D, Smit JH, Jansen R, de Geus E, Dunn E, Li QS, Nauck M, Schoevers RA, Beekman AT, Knowles JA, Viktorin A, Arnold P, Barr CL, Bedoya-Berrio G, Bienvenu OJ, Brentani H, Burton C, Camarena B, Cappi C, Cath D, Cavallini M, Cusi D, Darrow S, Denys D, Derks EM, Dietrich A, Fernandez T, Figee M, Freimer N, Gerber G, Grados M, Greenberg E, Hanna GL, Hartmann A, Hirschtritt ME, Hoekstra PJ, Huang A, Huyser C, Illmann C, Jenike M, Kuperman S, Leventhal B, Lochner C, Lyon GJ, Macciardi F, Madruga-Garrido M, Malaty IA, Maras A, McGrath L, Miguel EC, Mir P, Nestadt G, Nicolini H, Okun MS, Pakstis A, Paschou P, Piacentini J, Pittenger C, Plessen K, Ramensky V, Ramos EM, Reus V, Richter MA, Riddle MA, Robertson MM, Roessner V, Rosário M, Samuels JF, Sandor P, Stein DJ, Tsetsos F, Van Nieuwerburgh F, Weatherall S, Wendland JR, Wolanczyk T, Worbe Y, Zai G, Goes FS, McLaughlin N, Nestadt PS, Grabe H-J, Depienne C, Konkashbaev A, Lanzagorta N, Valencia-Duarte A, Bramon E, Buccola N, Cahn W, Cairns M, Chong SA, Cohen D, Crespo-Facorro B, Crowley J, Davidson M, DeLisi L, Dinan T, Donohoe G, Drapeau E, Duan J, Haan L, Hougaard D, Karachanak-Yankova S, Khrunin A, Klovins J, Kučinskas V, Lee Chee Keong J, Limborska S, Loughland C, Lönnqvist J, Maher B, Mattheisen M, McDonald C, Murphy KC, Nenadic I, van Os J, Pantelis C, Pato M, Petryshen T, Quested D, Roussos P, Sanders AR, Schall U, Schwab SG, Sim K, So H-C, Stögmann E, Subramaniam M, Toncheva D, Waddington J, Walters J, Weiser M, Cheng W, Cloninger R, Curtis D, Gejman PV, Henskens F, Mattingsdal M, Oh S-Y, Scott R, Webb B, Breen G, Churchhouse C, Bulik CM, Daly M, Dichgans M, Faraone SV, Guerreiro R, Holmans P, Kendler KS, Koeleman B, Mathews CA, Price A, Scharf J, Sklar P, Williams J, Wood NW, Cotsapas C, Palotie A, Smoller JW, Sullivan P, Rosand J, Corvin A, Neale BM, Schott JM, Anney R, Elia J, Grigoroiu-Serbanescu M, Edenberg HJ, Murray R, Brainstorm Consortium Analysis of shared heritability in common disorders of the brain. Science. 2018;360:eaap8757. doi: 10.1126/science.aap8757. - DOI - PMC - PubMed
    1. Asahara S, Shibutani Y, Teruyama K, Inoue HY, Kawada Y, Etoh H, Matsuda T, Kimura-Koyanagi M, Hashimoto N, Sakahara M, Fujimoto W, Takahashi H, Ueda S, Hosooka T, Satoh T, Inoue H, Matsumoto M, Aiba A, Kasuga M, Kido Y. Ras-related C3 botulinum toxin substrate 1 (RAC1) regulates glucose-stimulated insulin secretion via modulation of F-actin. Diabetologia. 2013;56:1088–1097. doi: 10.1007/s00125-013-2849-5. - DOI - PMC - PubMed
    1. Ba W, van der Raadt J, Nadif Kasri N. Rho GTPase signaling at the synapse: implications for intellectual disability. Experimental Cell Research. 2013;319:2368–2374. doi: 10.1016/j.yexcr.2013.05.033. - DOI - PubMed
    1. Ba W, Yan Y, Reijnders MRF, Schuurs-Hoeijmakers JHM, Feenstra I, Bongers EMHF, Bosch DGM, De Leeuw N, Pfundt R, Gilissen C, De Vries PF, Veltman JA, Hoischen A, Mefford HC, Eichler EE, Vissers LELM, Nadif Kasri N, De Vries BBA. TRIO loss of function is associated with mild intellectual disability and affects dendritic branching and synapse function. Human Molecular Genetics. 2016;25:892–902. doi: 10.1093/hmg/ddv618. - DOI - PMC - PubMed

Substances