. 2025 Jun 2;66(6):31.
doi: 10.1167/iovs.66.6.31.

Age-Related Dysregulation of α5β1 and αvβ3 Integrin Activity Alters Contractile Properties of Trabecular Meshwork Cells

Affiliations

Age-Related Dysregulation of α5β1 and αvβ3 Integrin Activity Alters Contractile Properties of Trabecular Meshwork Cells

Kassidy L Johns et al. Invest Ophthalmol Vis Sci. .

Abstract

Purpose: Age and elevated intraocular pressure are major risk factors for primary open-angle glaucoma (POAG) which is caused by a restriction in aqueous humor outflow from the anterior chamber. In this study, we investigated whether age-related changes in integrin subunit expression and activity signifies an early event in initiating fibrotic-like changes in the TM that could restrict outflow.

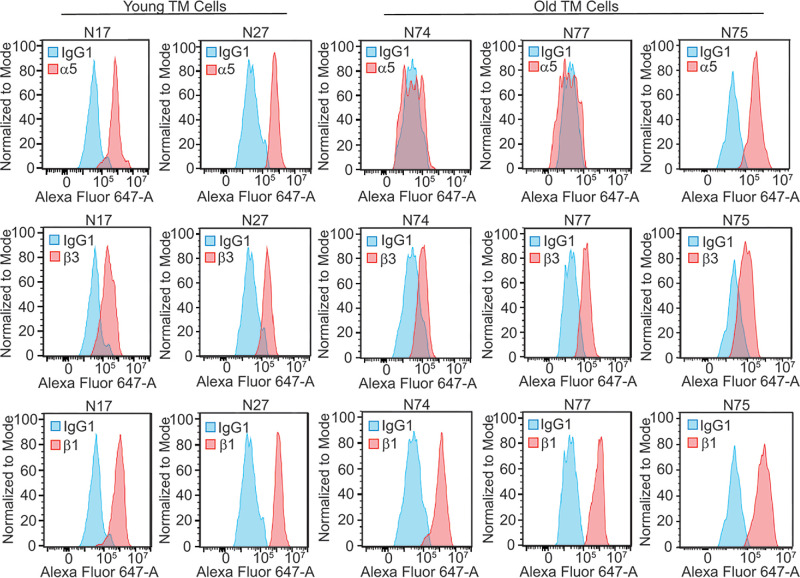
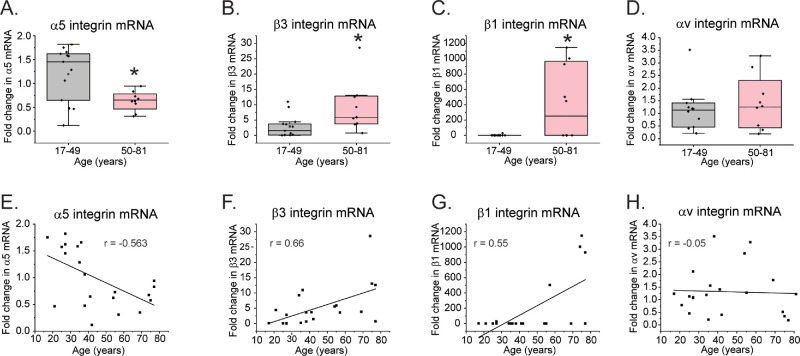
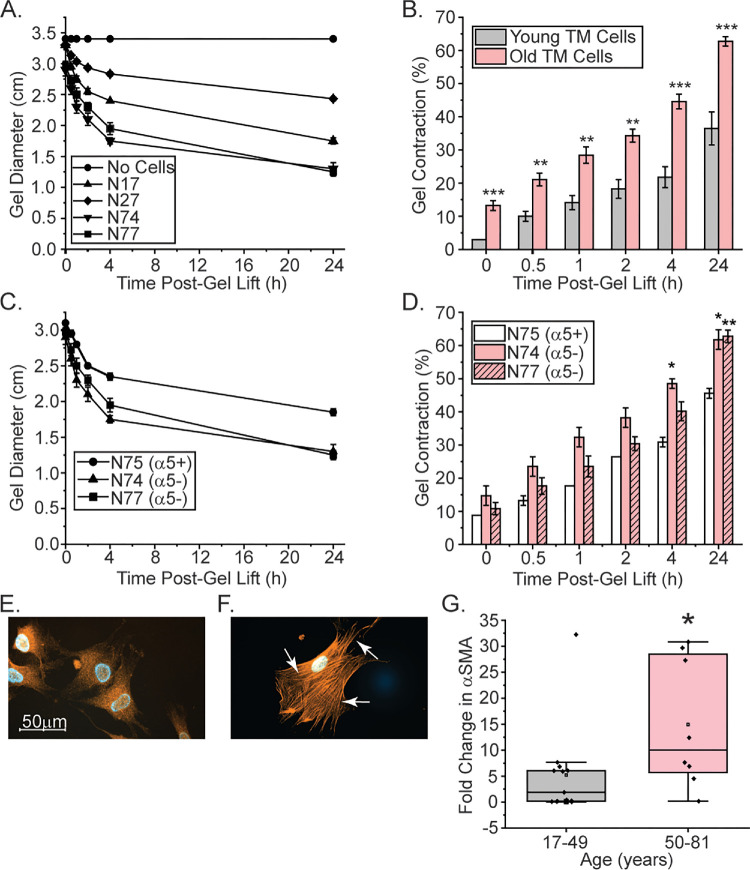
Methods: Human trabecular meshwork (TM) cells from young (<40 years) and old (>50 years) donor eyes were used. Flow cytometry, RT-qPCR, and immunofluorescence microscopy were used to evaluate levels of integrin and αSMA expression. On-cell westerns were used to determine fibronectin levels. Collagen gel contraction assays were used to determine contractile properties of cells and shRNA was used to knockdown α5β1 integrin levels.

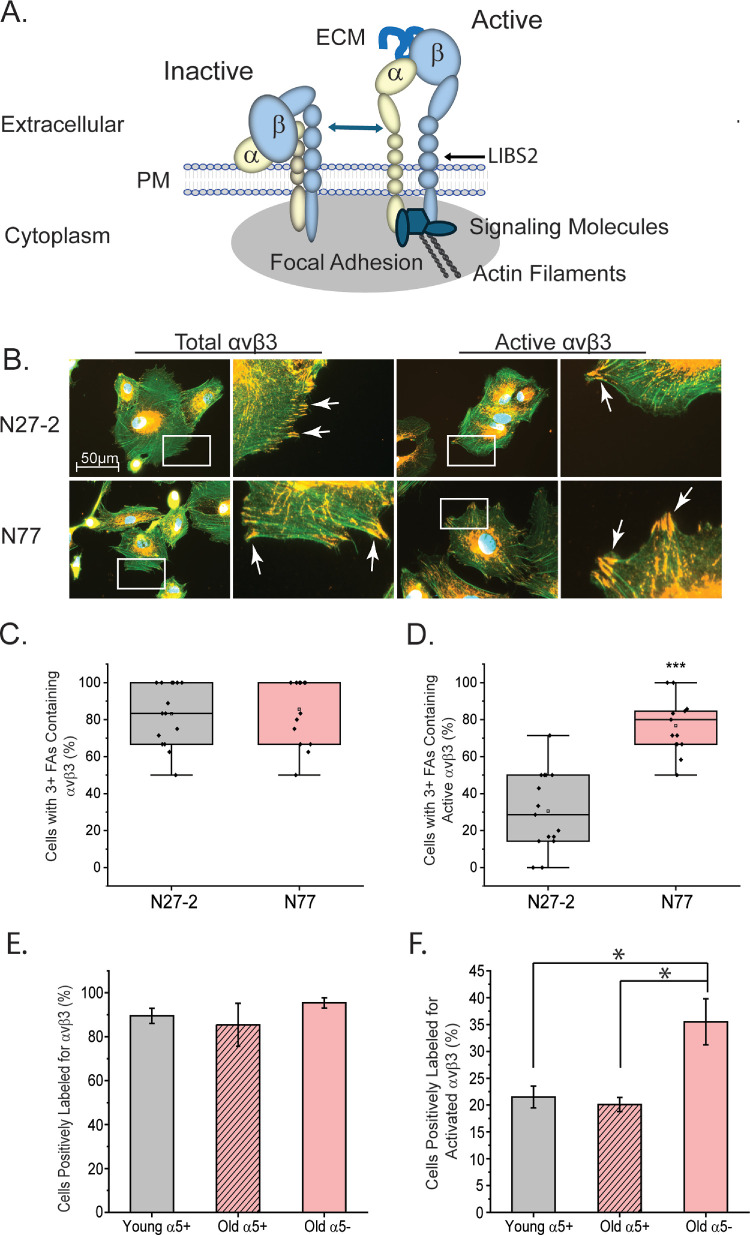
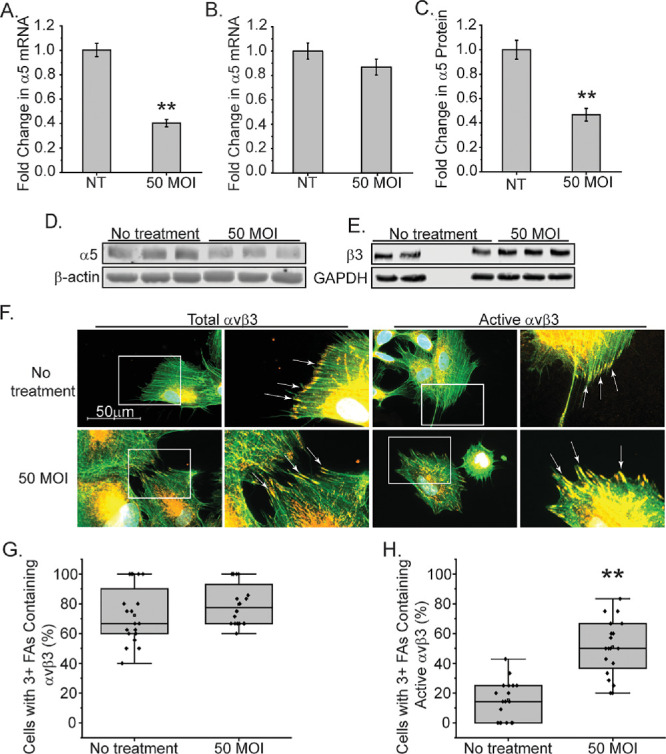
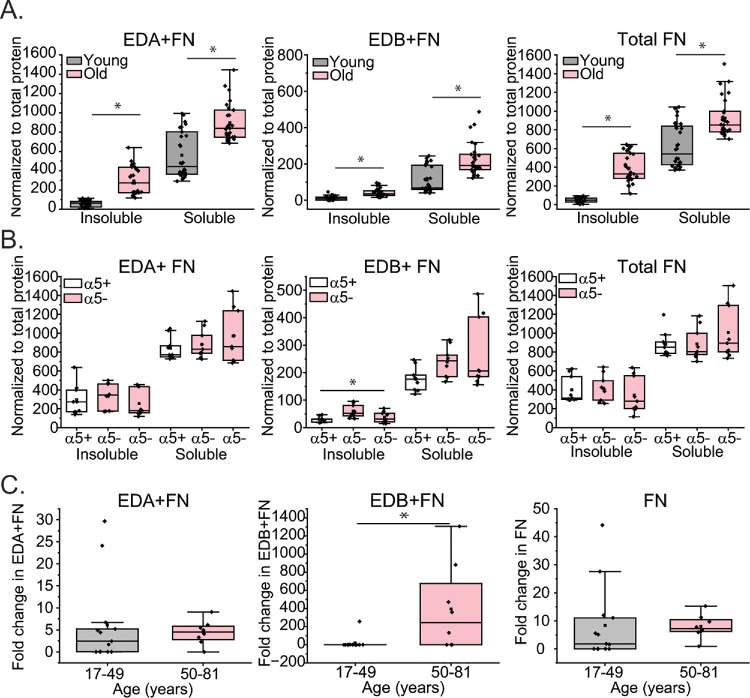
Results: Studies revealed a significant decrease in α5 integrin expression in TM cells from older individuals. This loss was accompanied by an increase in activated but not total αvβ3 integrin levels. TM cells from older donors expressed higher levels of αSMA mRNA, assembled αSMA-containing stress fibers, and contracted collagen gels significantly more than young TM cells. TM cells from old donors also assembled higher levels of insoluble fibronectin fibrils and contained higher levels of EDB+ fibronectin in their extracellular matrix. shRNA knockdown of α5 integrin subunits showed that the increase in αvβ3 integrin activity was due to lower levels of α5 integrin expression.

Conclusions: These studies suggest that age-related dysregulation of α5β1 and αvβ3 integrin signaling may represent an important early molecular event in inducing fibrogenic pathways associated with POAG.


Conflict of interest statement

Disclosure: K.L. Johns, None; J.A. Faralli, None; M.S. Filla, None; N.S. Shah, None; Y.Y. Sun, None; K.E. Keller, None; D.M. Peters, None

Figures

Figure 1.
Figure 1.
An age-related loss of α5 integrin subunit is seen in two out of three old TM cell strains. Flow cytometry for α5, β3, and β1 integrin subunits was done on two young cell strains (N17, N27) and three old cell strains (N74, N75 and N77). Blue peaks are cells labeled with control IgG, whereas pink peaks are cells labeled with either P1D6 mAb (α5 integrin; top panels), LM609 mAb (β3 integrin subunit; middle panels), or 12G10 (β1 integrin; bottom panels). In contrast to young TM cells, α5 integrin labeling is not above background in two of the old TM cells (N74 and N77), indicating that α5 integrin levels on the cell surface are lower. The third old cell strain (N75) had similar levels of α5 integrin as the two young cell strains (N17 and N27). Both young and old TM cells express similar levels of the β3 and β1 integrin subunits (middle and bottom panels, respectively). N = >2000 cells per cell group after gating.
Figure 2.
Figure 2.
RT-qPCR analysis of α5, β3, β1 and αv integrin mRNA levels. (A) The mRNA levels for the α5 integrin subunit are statistically higher in TM cells from young donor eyes (gray) compared to levels found in TM cells from old donor eyes (pink). (B, C) In contrast, levels of β3 and β1 integrin subunits mRNAs are decreased in TM cells from young donor eyes compared to cells from old donor eyes. (D) There is no significant difference in αv integrin mRNA levels present between young and old TM cells. Statistically significant differences were confirmed using both an unpaired t-test and Mann-Whitney test for A, B, and C. (*P < 0.05). N = 13 biological replicates for young TM cells, N = 8 for old cells. (EH) Scatter plots of α5, β3, β1, and αv integrin mRNA levels, respectively, relative to age. Levels of α5 integrin mRNA appear to decline as the age of the individual increases. In contrast, the levels of β3 integrin mRNA exhibits a modest increase as the age of the individual increases. Levels of β1 integrin mRNA appear relatively unchanged except for a few individuals over 50 years of age while no change in αv mRNA levels with age was observed. r = Pearson's correlation coefficient.
Figure 3.
Figure 3.
Immunolabeling for α5 integrin in anterior segments from young and old eyes. (A) Location of the TM in the angle of the anterior segment. (B) Schematic of the TM showing that it consists of several layers of fenestrated beams covered by a monolayer of TM cells. This is followed by a region called the juxtacanalicular tissue (JCT) region which is composed of individual cells embedded in an ECM. This is the region where most of the outflow resistance lies due to fibrotic changes that occur during POAG. AH (arrows) flows into the TM from the anterior chamber (AC) and exits through the inner wall (IW) of Schlemm's canal (SC) to the distal vessels (DV). (C) An H&E-stained section showing the typical morphology of the TM in a section of the anterior segment from a 36-yr-old donor eye. Scale bar: 50 µm. (DI) Sections of anterior segments from 21-year-old (DF) and 74-year-old (GI) donor eyes. Sections were labeled with mAb 10F6 against α5 integrin (D, E, G, H), or an IgG control antibody against β-galactosidase (F, I). Asterisks in D and G show regions that are at higher magnification in E and H, respectively. The α5 integrin labeling is ubiquitous within the TM beam cells and JCT in the 21-year-old tissue but is greatly reduced or scattered within the beam cells and JCT from the 74-year-old tissue. Both young and old tissue samples show α5 integrin labeling along the SC indicating that the loss of α5 integrin is specific to TM cells. A similar decrease in α5 integrin labeling was also observed in the TM from which the N77 cell strain was isolated (data not shown). In both young and old tissues, the α5 integrin labeling is clearly above the background labeling and shows a cell specific labeling pattern. The IgG control labeling in F and I, which differs from the α5 integrin labeling pattern, shows a similar nonspecific labeling pattern of IgG. This labeling pattern is presumably due to aggregation of the primary and/or secondary antibodies or autofluorescent structures. N = 2 biological replicates/age group. Arrows indicate TM beam cell labeling; arrowheads indicate SC endothelium labeling. (D) Scale bar: 20 µm for panels D, F, G, and I. (E) Scale bar: 20 µm for E and H. The 21-year-old, 74-year-old and 77-year-old tissues correspond to donors 2021-0755, 2021-1493, and 2021-1110, respectively, in Supplementary Table S1.
Figure 4.
Figure 4.
Old TM cells are more contractile than young TM cells and express higher levels of αSMA. (A, B) Young and old TM cells were plated onto collagen gels (1.25 mg/ml) for 24 hrs. The gels were then rimmed to release them from each plate. Old cells were statistically more contractile than younger donor cells within minutes of releasing the gels. N = 2 biological replicates/age group. All experiments were done in triplicate and repeated three times. (C, D) By four hours, old α5-negative TM cells are statistically more contractile than old α5-positive TM cells. Statistical analysis was done using a one-way ANOVA. Collagen contractility assays were done as described above. All experiments were done in duplicate or triplicate. *P < 0.05, **P < 0.01, ***P < 0.001. Bars: S.E.M. (E, F) Immunofluorescent microscopy images showing that αSMA+ stress fibers were not formed in N27-2 cells from a young donor (E) in contrast to the N77 cells from an old donor eye (F). Cells were plated onto collagen-coated coverslips for 24 hours and labeled with anti-αSMA antibody, as described in materials and methods. White arrows indicate the αSMA+ stress fibers. Scale bar: 50 µm. (G) RT-qPCR of αSMA mRNA levels in young (gray) and old (pink) TM cells show that mRNA levels for αSMA are significantly upregulated in old cells compared to younger cells suggesting that old cells are more contractile. Statistically significant differences were confirmed using both an unpaired t-test and Mann-Whitney test. *P < 0.05. The N27-2 and N77 TM cells were isolated from donors N27TM-2 and 2021-1110, respectively, in Supplementary Table S1.
Figure 5.
Figure 5.
Higher levels of active αvβ3 integrin are localized within focal adhesions and on the cell surface in older TM cells. (A) Schematic showing that integrins are heterodimeric transmembrane proteins consisting of an α and β subunit that interact with the ECM. They can exist in both an active and inactive state within the sites of contact with the ECM called focal adhesions. The active integrin has an upright conformation, can bind to ECM proteins and interact with cytoplasmic signaling molecules that trigger the assembly of actin stress filaments. (B) Young N27-2 and old N77 TM cells were labeled for total αvβ3 integrin levels (mAb [BV3]) and active αvβ3 integrin (mAb LIBS2). Both TM cell strains showed numerous focal adhesions (white arrows) containing αvβ3 integrin and some focal adhesions that were positive for active αvβ3 integrin. (C) Quantitation of number of young (gray) or old (pink) cells containing three or more focal adhesions did not show a statistical difference in the number of cells that contained αvβ3 integrin in focal adhesions. Number of N27-2 and N77 cells counted were 101 and 87, respectively. (D) In contrast, quantitation of the number of cells containing three or more focal adhesions that contained active αvβ3 integrin were statistically higher in old cells (pink) compared to young cells (gray). Number of N27-2 and N77 cells counted were 91 and 103, respectively. ***P < 0.001. Statistical analysis was done using an unpaired t-test and Mann-Whitney test. (E) Flow cytometry analysis of total levels of αvβ3 integrin on young and old TM cell strains. Total integrin levels were determined using mAb LM609 against αvβ3 integrin. No difference was observed between the different cell strains. (F) Flow cytometry analysis of activated αvβ3 integrin levels on young and old TM cell strains. Levels of activated αvβ3 integrin were determined using mAb LIBS2. Higher percentage of the old α5-negative cells contained activated αvβ3 integrin compared to both the young cell strains and the old, α5+positive cell strain, *P < 0.05. For E and F, cells were processed for flow cytometry as described in materials and methods. Studies used two α5-negative old TM cells strains (N74 and N77), the one α5-positive old TM cell strain (N75) and six young TM (N17, N25, N27, N27-2 and N35) strains. N = 5 biological and 3 technical replicate for young TM cells. N = 2 biological replicates for the α5-negative old TM cells and N = 2 technical replicates for α5-positive old TM cells. Statistical analyses were done using a one-way ANOVA. *P < 0.05.
Figure 6.
Figure 6.
Knockdown of α5 integrin subunit in young TM cells triggers an increase in β3 integrin activity. (A) N25 TM cells were transduced with a lenti-α5 shRNA viral vector (MOI 50). By RT-qPCR, there was a significant 60% reduction in α5 integrin mRNA compared to untransduced cells when analyzed. (B) N25 TM cells transduced with a non-targeting control vector showed no effect on α5 integrin mRNA levels. The control vector used was a lenti-β3 integrin shRNA viral vector (MOI 50). (C, D) Western blot analysis showed a significant 50% decrease in the α5 integrin subunit in transduced cells compared to untransduced cells by an unpaired t-test. GAPDH was used as a loading control. (E) Western blot analysis showed that levels of the β3 integrin subunit were unchanged when α5 integrin was knocked down. (F) Immunofluorescence microscopy of transduced and untransduced N25 cells labeled for total levels of αvβ3 integrin (mAb [BV3]) or activated αvβ3 integrin (mAb LIBS2) in focal adhesions (arrows). Cells were stained with Alexa 488 phalloidin to detect actin filaments. Scale bar: 50 µm. (G) Untransduced and transduced N25 cells with three or more focal adhesions show similar levels of focal adhesions containing αvβ3 integrin, with no statistical difference. The number of cells counted per treatment group ranged between 99–114 cells. (H) The number of transduced N25 TM cells with three or more focal adhesions containing activated αvβ3 integrin was statistically higher compared to control cells. The number of cells counted per treatment group ranged between 99–111. **P < 0.01. Statistically significant differences were confirmed using both an unpaired t-test and Mann-Whitney test.
Figure 7.
Figure 7.
Assembly of fibronectin fibrils and expression of the EDB + isoform of fibronectin (FN) is higher in old TM cells. Expression of fibronectin and its EDA+ and EDB + isoforms was measured in three young cell lines (N17, N27-2, N25) and three old cell lines (N74, N75, and N77) using an OCW as described in material and methods. (A) EDA+, EDB+, and total FN was significantly higher in both soluble and insoluble fractions of cell layers from old cells compared to young cells. (B) Levels of EDA+ and total FN in both soluble and insoluble fractions were similar in all three old cell lines. EDB + FN, however, was found to be significantly higher in the insoluble matrix in one α5-negative cell line (N77) compared to the α5 + positive N75 old cell line. *P < 0.05. N = 3 biological replicates/age group. All experiments were done in triplicate and repeated in 4 independent experiments. (C) Quantitative PCR of EDA+, EDB+, and FN mRNA levels in old (pink) and young (gray) cells show that mRNA levels for EDB+FN were significantly increased in old cell lines. *P < 0.05. Statistically significant differences were confirmed using both an unpaired t-test and Mann-Whitney test in panels A and C. A one-way ANOVA with a post-hoc Tukey HSD test and a Kruskal-Wallis nonparametric with post-hoc Dunn's test using the Bonferroni correction was used for the statistical analysis in panel B.
Figure 8.
Figure 8.
Model of integrin switching in aging TM. Young TM cells initially express both α5β1 and αvβ3 integrins on their cell surface and lack actin filaments containing αSMA. αvβ3 integrins on these young cells appear to be a mixture of both active (upright conformation) and inactive (bent conformation) integrins. As the TM cells age, there is a loss of α5β1 integrins, increased activation of αvβ3 integrin on the cell surface, and an enhancement in the contractile activities of the cells. This increased contractile activity appears to be driven by the activated αvβ3 integrin that causes initiation of mechanotransduction and an increase in αSMA+ stress fibers.

Similar articles

References

    1. Gabelt BT, Kaufman PL. Changes in aqueous humor dynamics with age and glaucoma. Prog Retin Eye Res. 2005; 24: 612–637. - PubMed
    1. Liu B, McNally S, Kilpatrick JI, Jarvis SP, O'Brien CJ. Aging and ocular tissue stiffness in glaucoma. Surv Opthalamol. 2018; 63: 56–74. - PubMed
    1. Johnstone M, Xin C, Tan J, Martin E, Wen J, Wang RK. Aqueous outflow regulation—21st century concepts. Prog Retin Eye Res. 2021; 83. - PMC - PubMed
    1. Acott TS, Kelley MJ. Extracellular matrix in the trabecular meshwork. Exp Eye Res. 2008; 86: 543–561. - PMC - PubMed
    1. Keller KE, Peters DM. Pathogenesis of glaucoma: Extracellular matrix dysfunction in the trabecular meshwork—a review. Clin Exp Ophthalmol. 2022; 50: 163–182. - PMC - PubMed

MeSH terms