. 2025 Jun 9;40(1):266.
doi: 10.1007/s10103-025-04499-4.

Laser-stimulated human gingival fibroblasts: alterations in migration, secretome production, and induction of reactive oxygen species

Affiliations

Laser-stimulated human gingival fibroblasts: alterations in migration, secretome production, and induction of reactive oxygen species

Lina María Escobar et al. Lasers Med Sci. .

Abstract

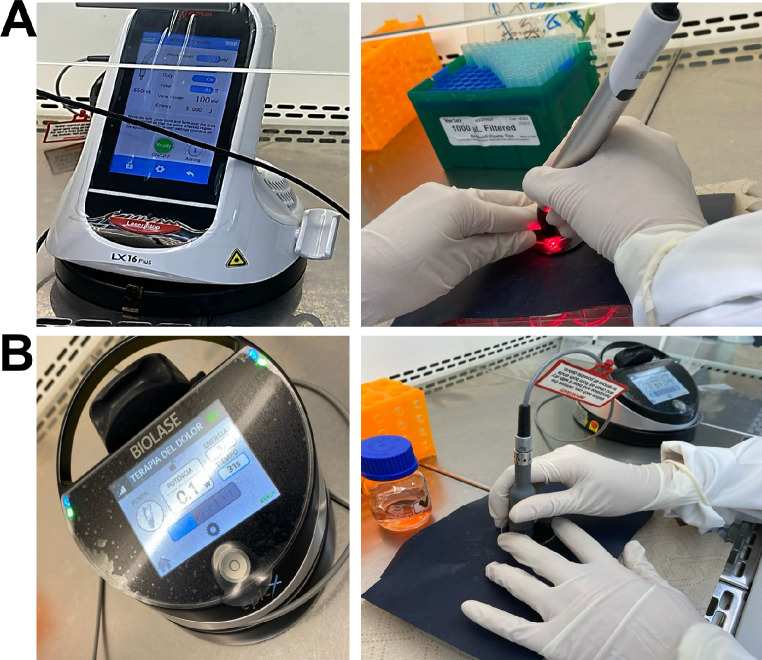
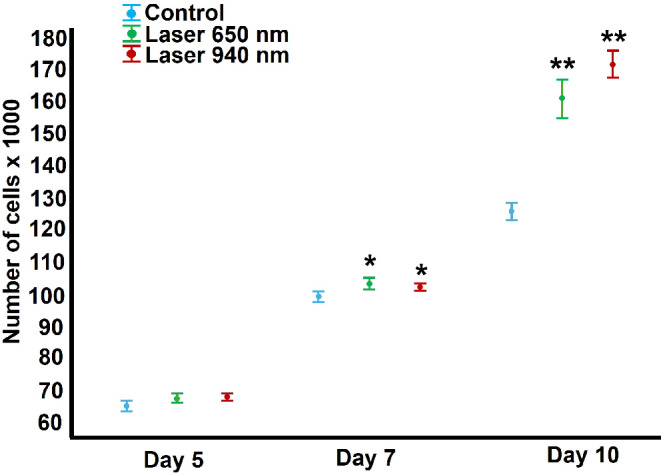
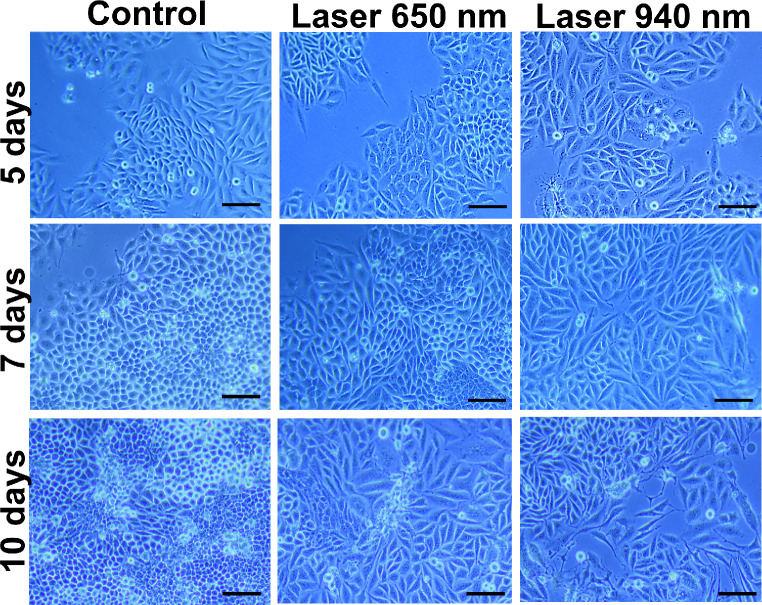
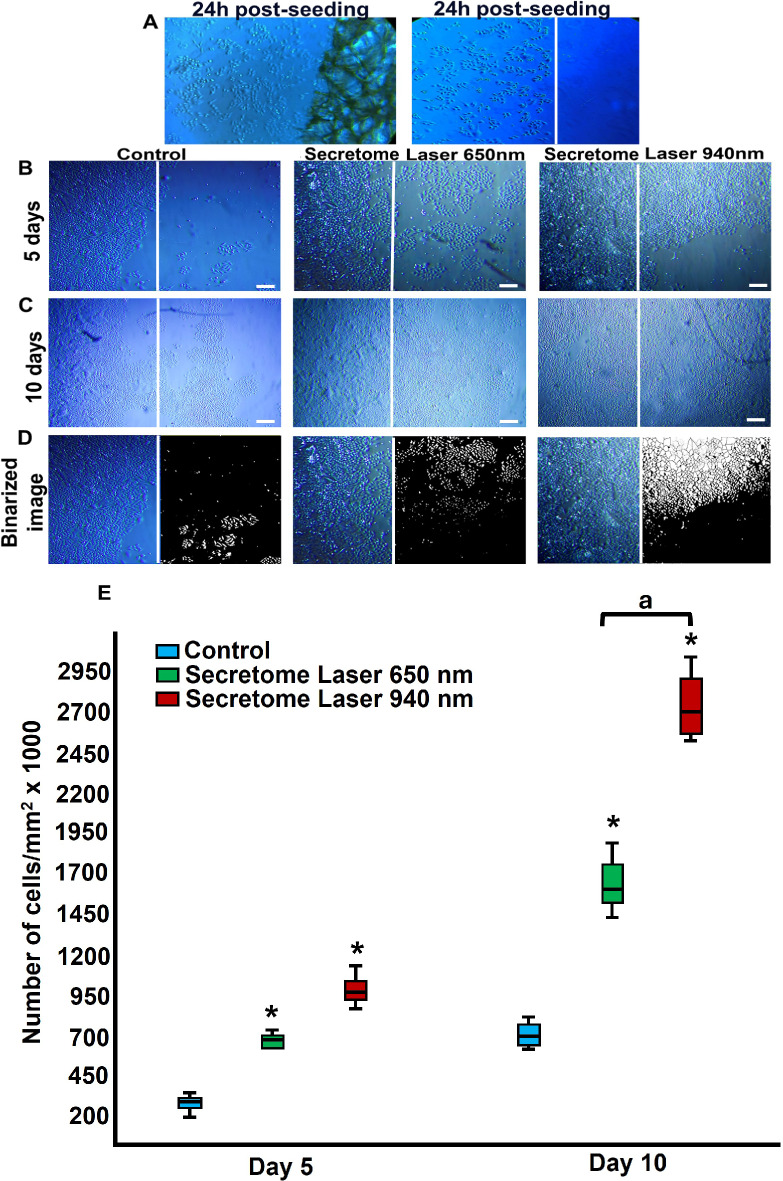
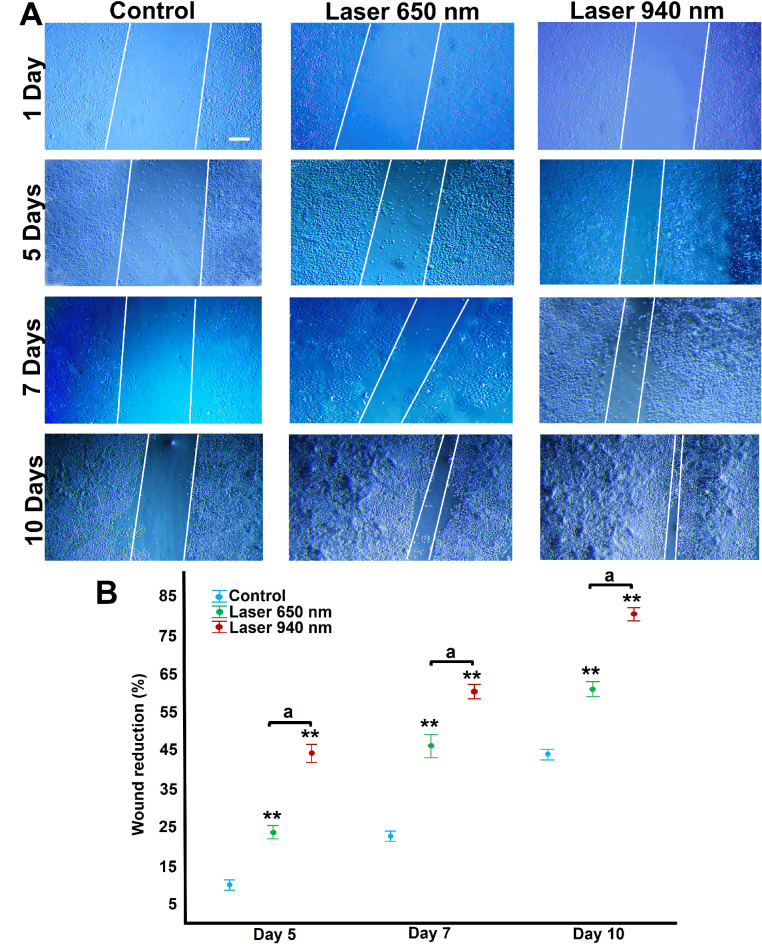
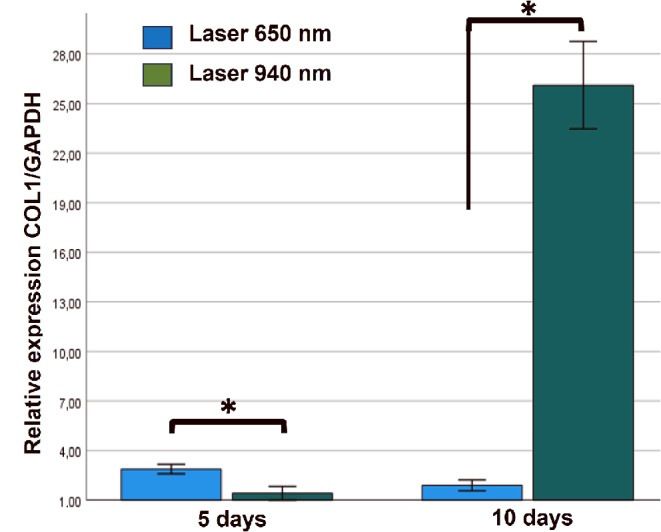
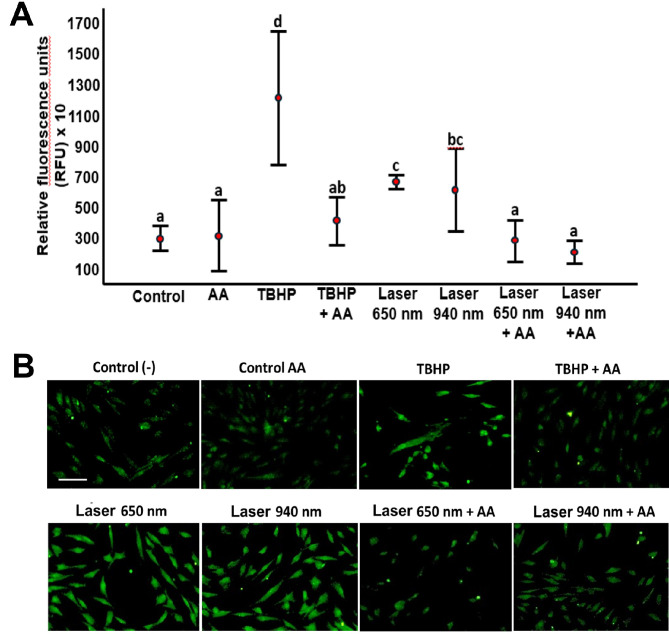
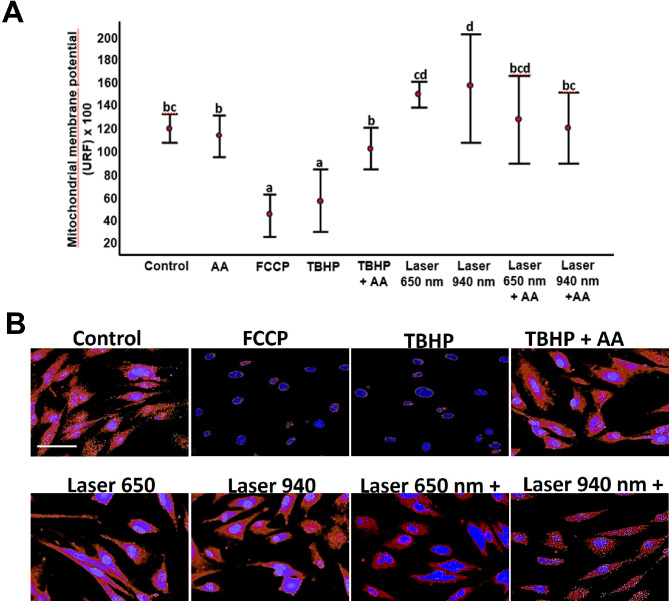
This study aimed to investigate the effects of low-level laser irradiation on human gingival fibroblasts, specifically examining changes in proliferation, morphology, migration, and reactive oxygen species (ROS) production. Additionally, we assessed the impact of the secretome from irradiated fibroblasts on non-irradiated cell proliferation and migration. Human gingival fibroblasts were exposed to 650-940 nm laser irradiation for 50 s. Cell proliferation was quantified using resazurin, while migration was evaluated through a wound generation assay and by treating non-irradiated cells with the secretome from irradiated fibroblasts. We also analysed changes in type I collagen (COL1A1) expression, ROS production, and mitochondrial membrane potential (ΔΨm). Both 650 nm and 940 nm laser treatments induced morphological changes and significantly enhanced cell proliferation, observed 10 days post-irradiation, without causing cell detachment or death. Non-irradiated cells treated with the secretome from 940 nm-irradiated fibroblasts exhibited increased cell density at five and 10 days post-irradiation. Laser treatment at both wavelengths significantly stimulated cell migration. Cells irradiated with the 650 nm laser showed increased COL1A1 expression at five days, while those treated with 940 nm demonstrated a marked increase at 10 days. Low-level laser treatment led to significant increases in both ROS production and ΔΨm. In conclusion, low-level laser treatment induced morphological changes and increased proliferation, cell migration, and COL1A1 expression in gingival fibroblasts. Treatment with laser-stimulated cell secretome significantly enhanced gingival fibroblast proliferation. The 940 nm laser treatment elicited the most pronounced cellular changes, particularly in relation to increased ROS production and ΔΨm.


Conflict of interest statement

Declarations. Ethical approval: This project was approved by the ethics committee of the Faculty of Dentistry, Universidad Nacional de Colombia (CIEFO-094-2023). All the participants signed the informed consent form. Competing interests: The authors declare no competing interests.

Figures

Fig. 1
Fig. 1
Application of laser on human gingival fibroblasts. Cells seeded in multiwell plates without culture medium were subjected to a single laser application, using a black plastic sheet to avoid scattering of the emitted laser light to adjacent wells, as shown in the photographs. A wavelength of 650 nm was applied with (A) the LX 16 Woodpecker diode laser device and a wavelength of 940 nm with (B) the Biolase Epic X diode laser
Fig. 2
Fig. 2
Effect on cell proliferation induced by LLLT. Treatment with 650 nm and 940 nm laser for 50 s produced a significant increase in cell number when compared to the group of cells without laser irradiation (Control) only at seven- and 10-days post-irradiation. No significant changes were determined at the other times. Data were analysed using a one-way ANOVA followed by Tukey’s HSD post hoc test, assuming homogeneous variances (Levene’s test). Statistically significant differences between treated and untreated control groups are indicated by asterisks *(p < 0.05), ** (p < 0.01). Results are presented as the mean and confidence interval (CI) from two independent experiments with three replicates each (n = 6)
Fig. 3
Fig. 3
Human gingival fibroblasts treated with lower-level laser. Cells were treated with 650 nm and 940 nm laser for 50 s and were maintained in culture for 10 days post-irradiation. The control group corresponded to cells without irradiation. Larger cells and cell prolongations were observed when the laser was applied compared to the control group. Magnification bar: 200 μm
Fig. 4
Fig. 4
Changes in the number of gingival fibroblasts induced by secretome treatment. Cells were seeded in a 6-well plate by dividing the well into two parts by adhering surgical tape (Micropore), which was removed at 24 h post-seeding (A). These cells were exposed to secretome obtained from 650 nm and 940 nm laser-treated cells. The results of secretome treatment were evaluated at five (B) and 10 days (C) by the ImageJ program using binary images that allowed cell counting (D). The white line corresponds to the boundary zone of the previously adhered surgical tape (Micropore). Changes in cell number were evaluated at five days and 10 days of culture and compared with the group of cells that were not treated with secretome (Control) (E). The data were compared within the same days, using the Kruskal-Wallis H test followed by Dunn’s multiple comparisons test. Statistically significant differences between treated and untreated control groups are indicated by asterisks *(p < 0.05), ** (p < 0.01). Lowercase letters (a) show significant differences between test groups. Results are presented as the median and interquartile range from two independent experiments with three replicates each (n = 6). Magnification bar: 100 μm
Fig. 5
Fig. 5
Cell migration and proliferation assay. (A) Representative photomicrographs of wound closure by fibroblasts after treatment with 650 nm and 940 nm laser at 24 h, five-, seven-, and 10-days post-irradiation are shown. White lines correspond to previously generated wound boundaries. Magnification bar: 100 μm. (B) The percentage of wound reduction was higher in cells treated with 940 nm laser at all times analysed (five-, seven-, and 10-days post-irradiation). The control group corresponds to non-irradiated cells. The data were compared within the same days, using a one-way ANOVA followed by Tukey’s HSD post hoc test, assuming homogeneous variances (Levene’s test). Statistically significant differences between treated and untreated control groups are indicated by asterisks *(p < 0.05), ** (p < 0.01). Lowercase letters (a) show significant differences between test groups. Results are presented as the mean and confidence interval (CI) from two independent experiments with three replicates each (n = 6)
Fig. 6
Fig. 6
Relative expression of COL1A1 in human gingival fibroblasts treated with Laser of 650 nm and 940 nm at five and 10 days. COL1A1 transcripts were quantified by RT-qPCR considering the transcript expression value of unexposed cells (baseline expression = 1). Data are expressed relative to glyceraldehyde 3-phosphate dehydrogenase (GAPDH) gene expression levels. The data were analysed within the same days using the Student’s t-test for independent samples, after verifying compliance with the assumption of normal distribution with the Shapiro Wilk statistic and homoscedasticity of variances with the Levene test. The P value less than 0.05 was statistically significant (*). Data are shown as the mean ± SD of two independent experiments in duplicate (n = 6)
Fig. 7
Fig. 7
Effect of low-level laser therapy (LLLT) on reactive oxygen species (ROS) production in human gingival fibroblasts. ROS production was assessed using the dichlorofluorescein diacetate (DCF-DA) technique in cells irradiated with 650 nm and 940 nm lasers for 50 s. Each treatment was evaluated in relative fluorescence units (RFU) and quantified by spectrofluorometry. Panel (A) shows ROS levels in the positive control group (TBHP), negative control (ascorbic acid, AA), cells co-incubated with TBHP and AA, and cells irradiated with both laser wavelengths, with or without AA. Statistical differences among groups were determined using Tukey’s HSD test. Groups sharing the same lowercase letter are not significantly different, as follows: (a) Control, AA, TBHP + AA, Laser 650 nm + AA, and Laser 940 nm + AA; (b) TBHP + AA and Laser 940 nm; (c) Laser 650 nm and Laser 940 nm; and (d) TBHP, which differed significantly from all other groups. Different lowercase letters indicate statistically significant differences (p < 0.05). Panel (B) displays ROS detection by fluorescence microscopy (Axiovert 40 CFL, Carl Zeiss, USA) using a contrast setting of 5000, a range of 1.25, brightness of 14,215, and an exposure time of 90.2 ms. Scale bar: 100 μm
Fig. 8
Fig. 8
Mitochondrial membrane potential in laser-treated human gingival fibroblasts. Fluorescence intensity for each treatment was compared to the negative control (untreated cells), which was considered the baseline mitochondrial membrane potential (Δψm), and statistical differences between groups were analyzed using Tukey’s HSD test. The figure shows fluorescence intensity corresponding to the positive controls (FCCP and TBHP), as well as cells treated with each laser wavelength and co-incubated with 50 µg/mL of ascorbic acid (AA). Fluorescence was measured using a spectrofluorometer (Infinite M200, Tecan; Männedorf, Switzerland) at 549 nm excitation and 575 nm emission. Groups sharing the same lowercase letter are not significantly different, as follows: (a) FCCP and TBHP; (b) Control, AA, TBHP + AA, Laser 650 nm + AA, and Laser 940 nm + AA; (c) Control, Laser 650 nm, Laser 650 nm + AA, and Laser 940 nm + AA; and (d) Laser 650 nm, Laser 650 nm + AA, and Laser 940 nm. Different lowercase letters indicate statistically significant differences among groups (p < 0.05). FCCP and TBHP showed significant differences compared to all other experimental groups

Similar articles

References

    1. Moradi A, Ghaffari Novin M, Bayat M (2024) A comprehensive systematic review of the effects of photobiomodulation therapy in different light wavelength ranges (blue, green, red, and near-infrared) on sperm cell characteristics in vitro and in vivo. Reprod Sci 31:3275–3302. 10.1007/s43032-024-01657-x - PubMed
    1. Almeida-Lopes L, Rigau J, Zângaro RA, Guidugli-Neto J, Jaeger MM (2001) Comparison of the low level laser therapy effects on cultured human gingival fibroblasts proliferation using different irradiance and same fluence. Lasers Surg Med 29:179–184. 10.1002/lsm.1107 - PubMed
    1. Karu TI (2010) Multiple roles of cytochrome C oxidase in mammalian cells under action of red and IR-A radiation. IUBMB Life 62(8):607–610. 10.1002/iub.359 - PubMed
    1. Wang H, Tian C, Zheng G, Wang J, Hu D (2017) Mechanisms and implications of photobiomodulation induced by low-level light therapy. Med Res Rev 37(4):1032–1063. 10.1002/med.21430
    1. Wang L, Mao L, Huang Z, Switzer JA, Hess DC, Zhang Q (2025) Photobiomodulation: shining a light on depression. Theranostics 15(2):362–383. 10.7150/thno.104502 - PMC - PubMed

MeSH terms

LinkOut - more resources