

Generating Timely Estimates of Overdose Deaths for the US Using Urine Drug Test Data
- PMID: 40489110
- PMCID: PMC12150189
- DOI: 10.1001/jamanetworkopen.2025.14402
Generating Timely Estimates of Overdose Deaths for the US Using Urine Drug Test Data
Abstract
Importance: Provisional estimates of fatal drug overdoses in the US are lagging by 6 months. Efforts to estimate the overdose burden for this 6-month lag window require up-to-date data, such as real-time urine drug test (UDT) data, capable of identifying sudden changes in the overdose trajectory, such as the increase in overdose deaths experienced at the beginning of the COVID-19 pandemic.
Objective: To evaluate the utility of using aggregated UDT data to estimate national-level drug overdose deaths for the 6-month lag window in which overdose data are unavailable.
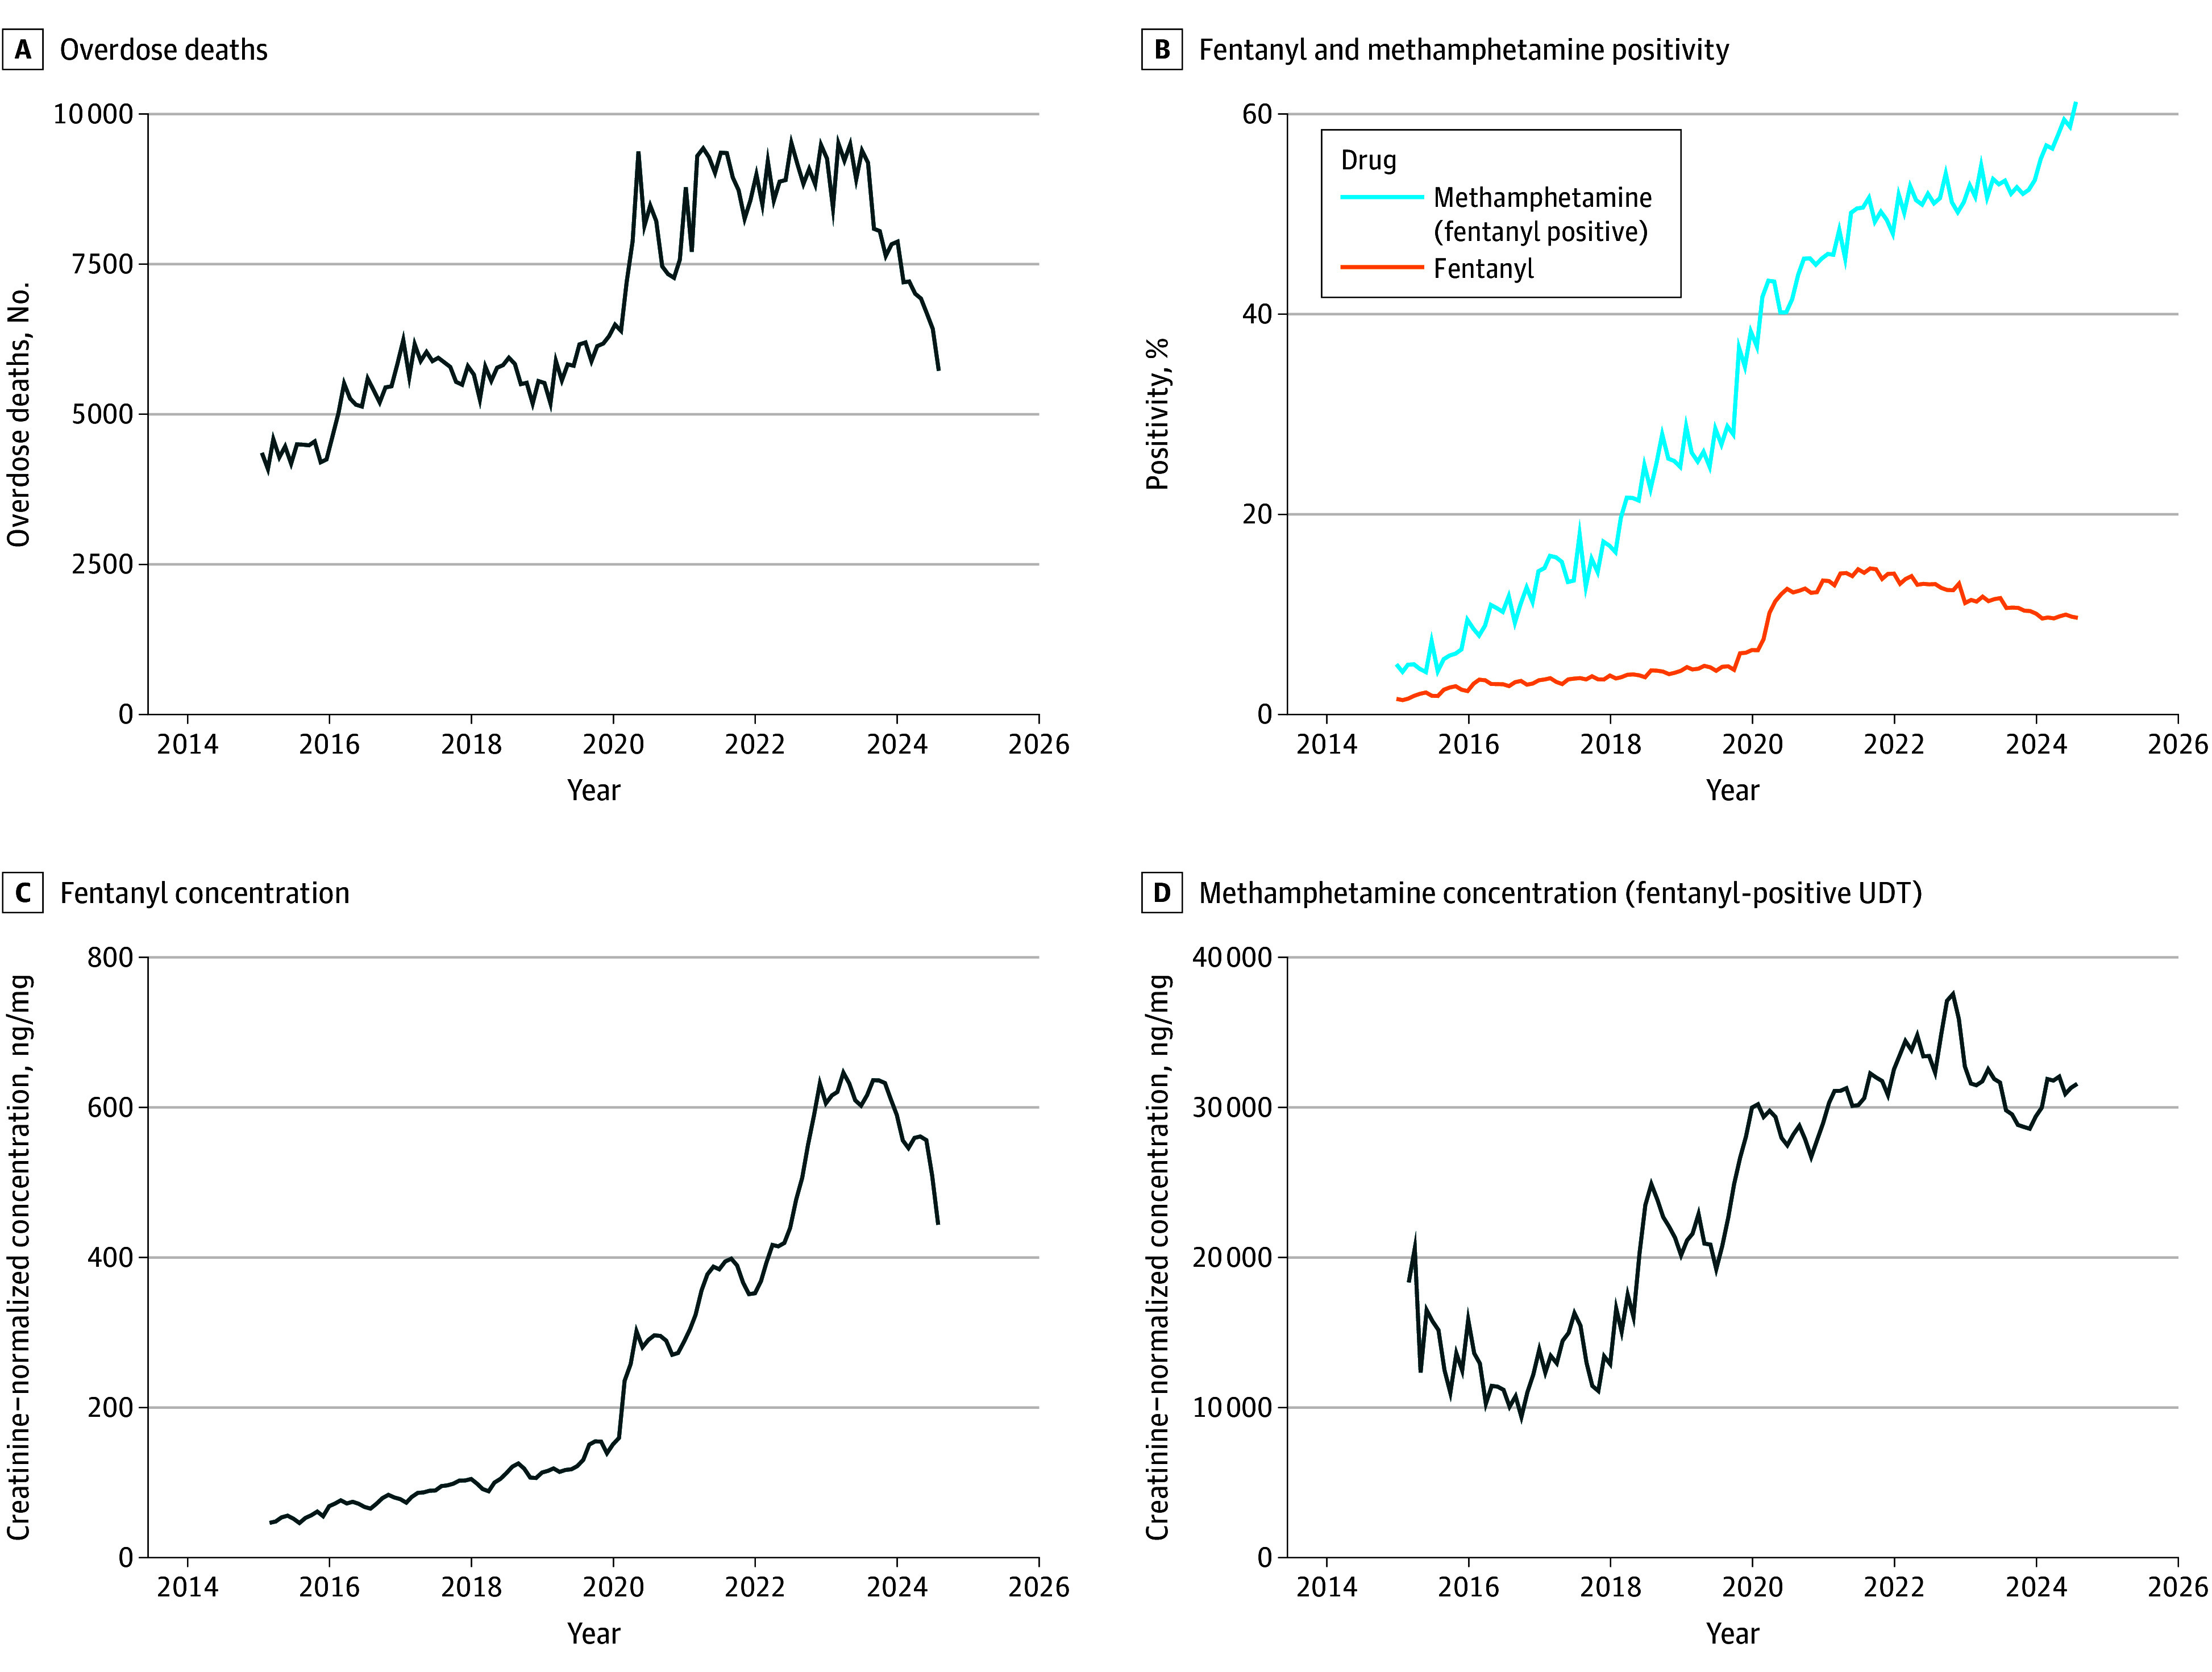
Design, setting, and participants: This cross-sectional study included 3 135 748 urine samples submitted for UDT by Millennium Health from patients aged 18 years or older in substance use disorder treatment health care facilities across the US between January 1, 2015, and January 31, 2025. Urine drug test results were aggregated to generate monthly positivity rates and mean creatinine-normalized levels of fentanyl and methamphetamine (among the sample testing positive for fentanyl). Monthly, national drug overdose mortality counts were obtained from the Centers for Disease Control and Prevention.
Exposures: Urine drug testing.
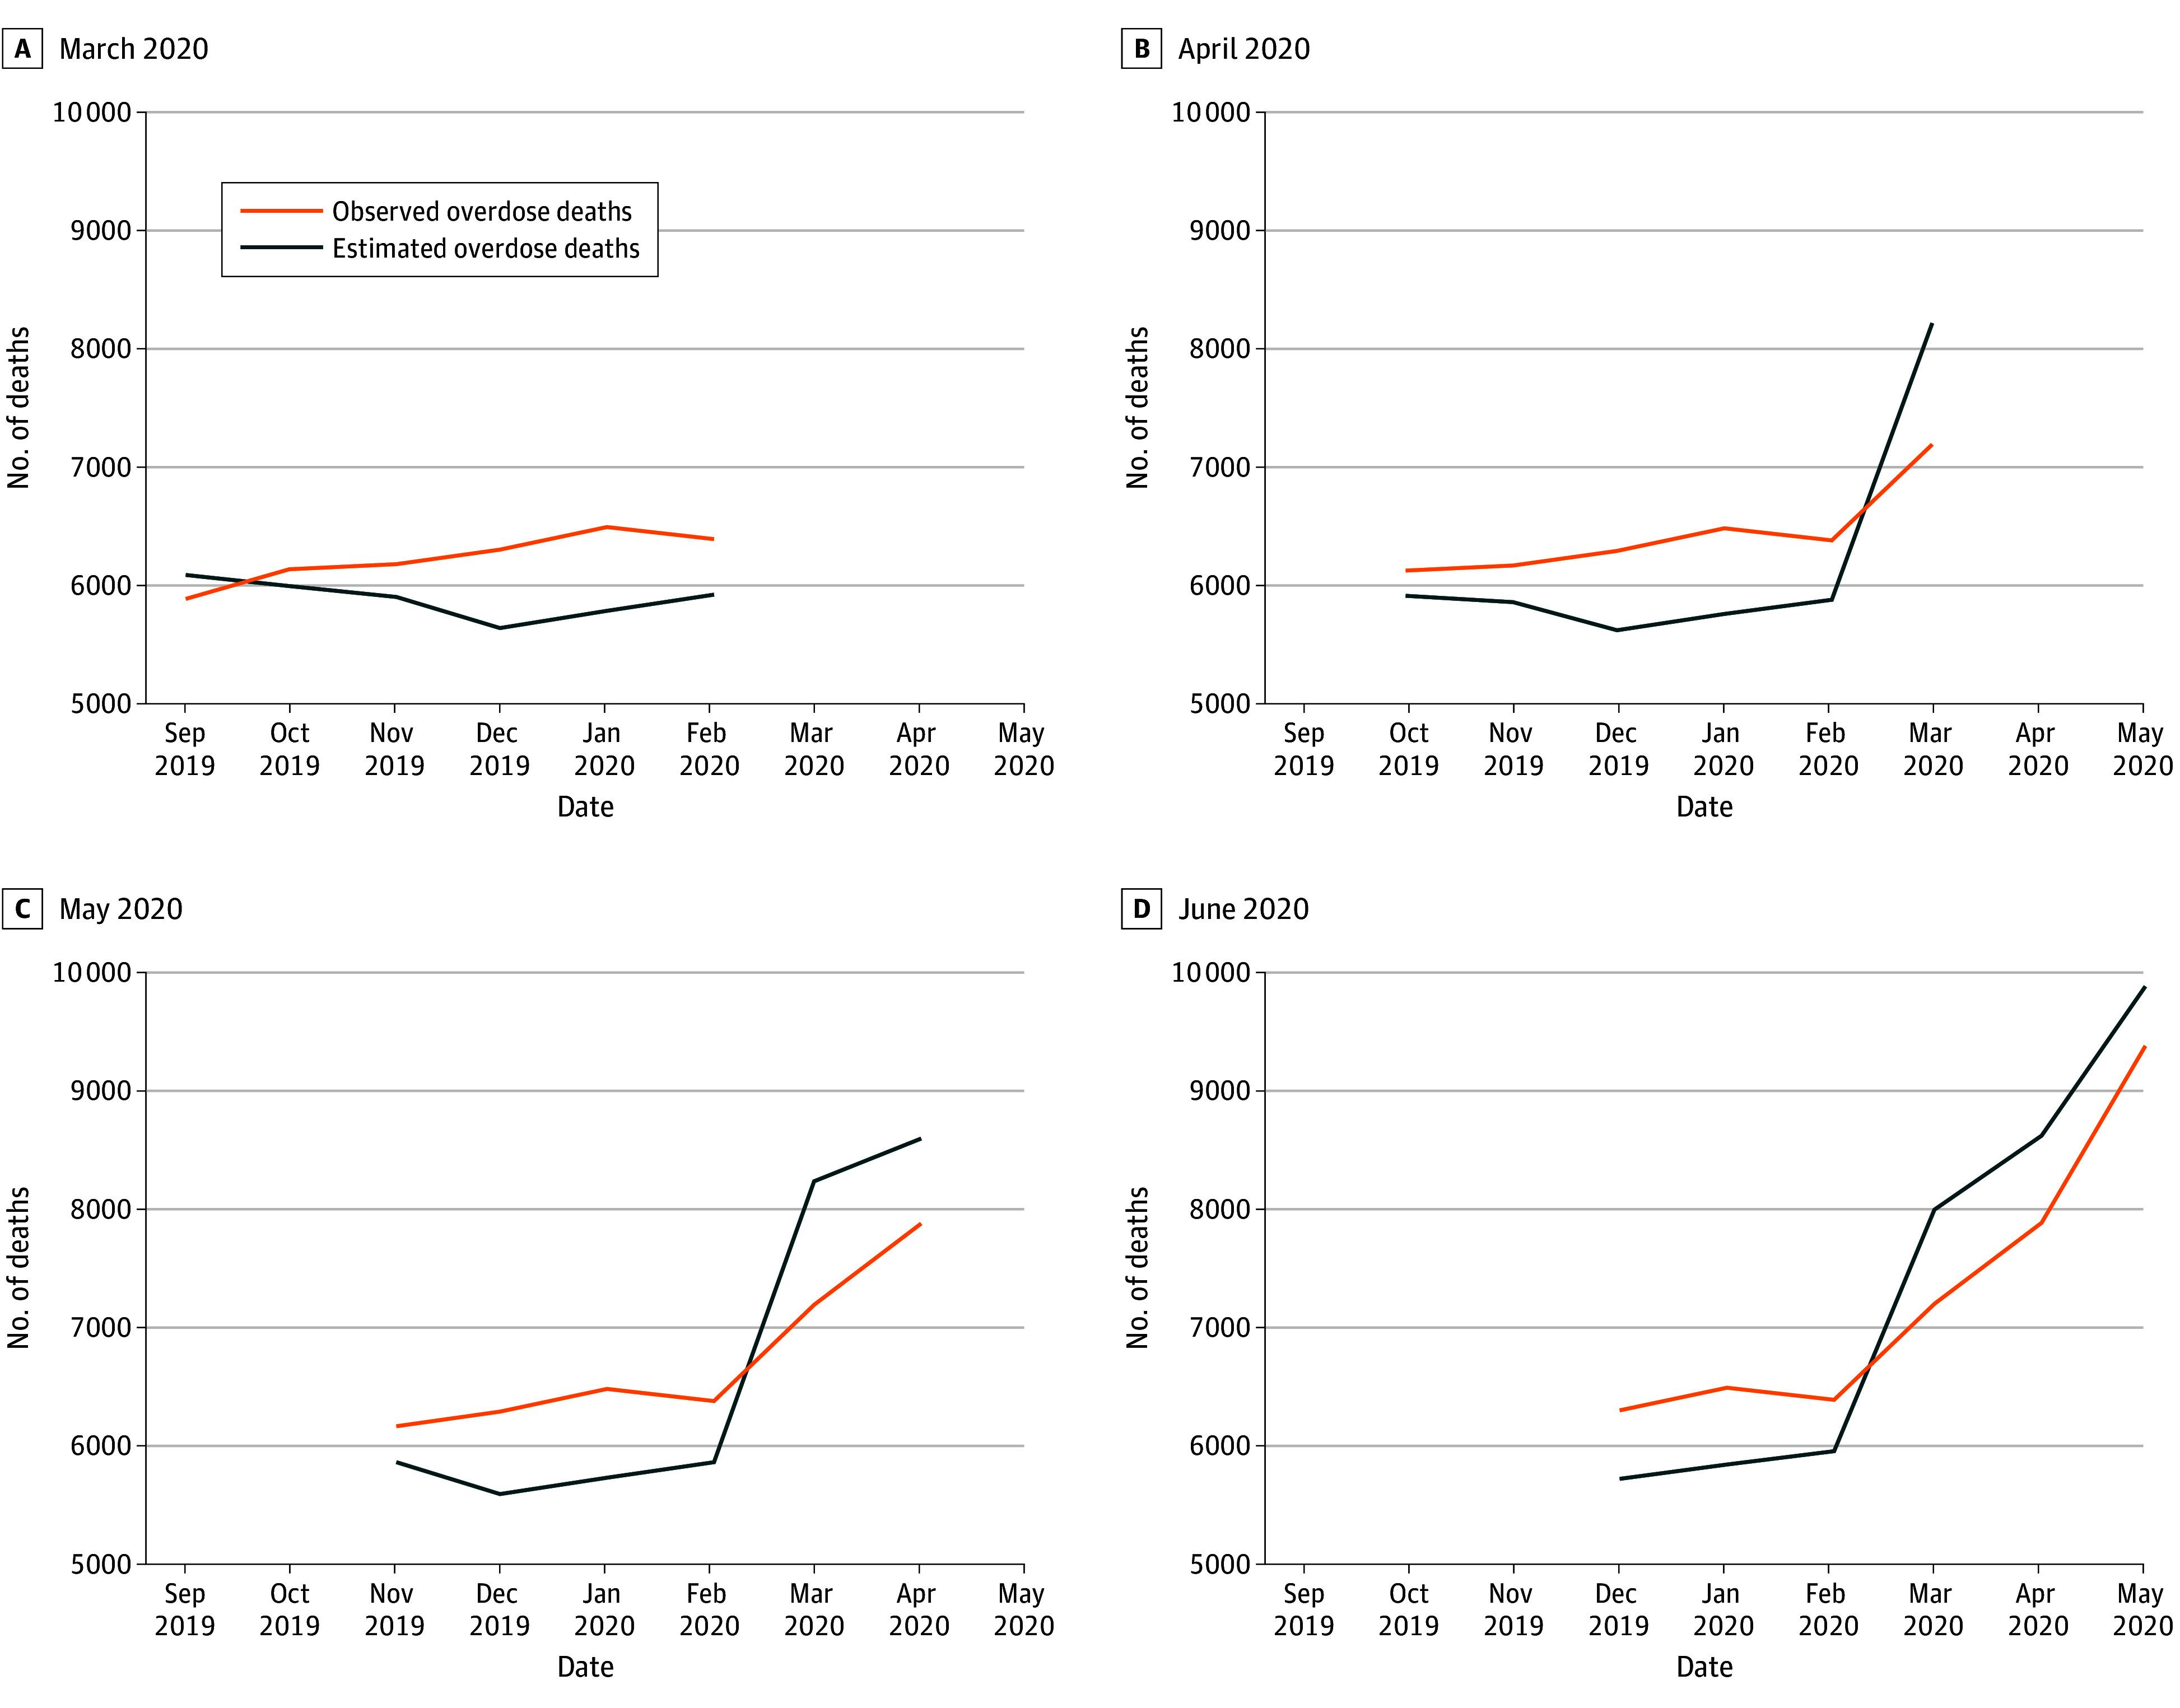
Main outcomes and measures: Drug overdose death totals were estimated for every 6-month period from January to June 2019 through August 2024 to January 2025 by training generalized linear models with a negative binomial distribution on the preceding 4 years of data and using monthly UDT data to generate overdose estimates for the 6-month lag window of interest. Mean absolute error (MAE), mean absolute percentage error (MAPE), and root mean squared error (RMSE) were calculated by comparing projected monthly estimates with observed overdose death totals.
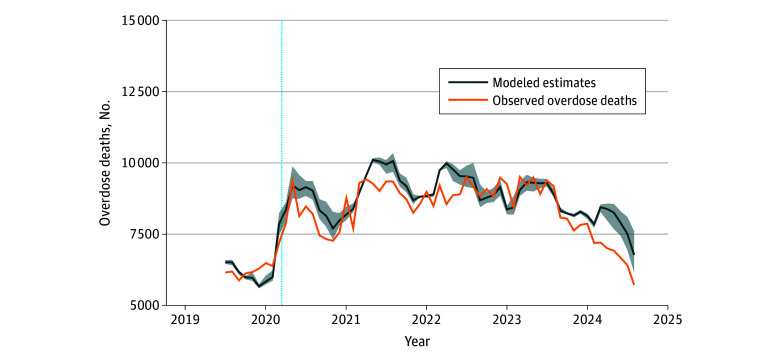
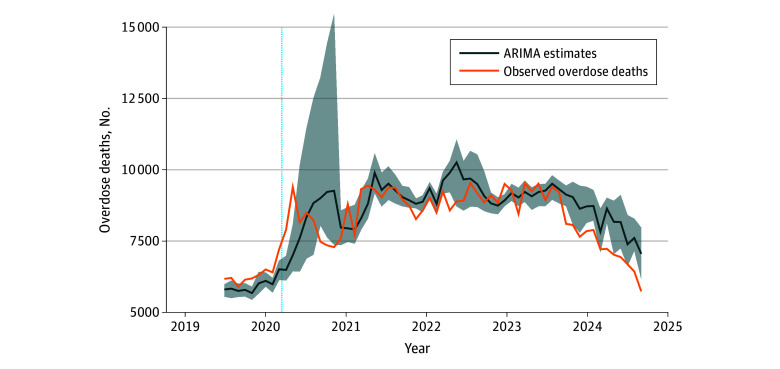
Results: A total of 3 135 748 UDT specimens (57.2% from men; mean [SD] age, 38.1 [12.4] years) were included in this study. From 2019 to August 2024, 537 104 people died of an overdose in the US, with a substantial increase in early 2020 at the onset of the COVID-19 pandemic. The UDT modeling strategy (MAPE, 7.1%; MAE, 540.9 deaths per month; RMSE, 659.4) outperformed the baseline autoregressive integrated moving average model (MAPE, 9.0%; MAE, 704.9 deaths per month; RMSE, 1075.8) across all metrics. Furthermore, the model detected the sudden increase in overdose deaths at the start of the COVID-19 pandemic.
Conclusions and relevance: In this cross-sectional study, findings suggested that aggregated UDT data may be used to estimate up-to-date overdose death trends. Model implementation can be improved by introducing additional exposure variables, such as those related to drug seizures and syndromic surveillance.
Conflict of interest statement
Figures
Similar articles
-
Fentanyl, Heroin, Methamphetamine, and Cocaine Analyte Concentrations in Urine Drug Testing Specimens.JAMA Netw Open. 2024 Oct 1;7(10):e2441063. doi: 10.1001/jamanetworkopen.2024.41063. JAMA Netw Open. 2024. PMID: 39446323 Free PMC article.
-
Rapid, point-of-care antigen tests for diagnosis of SARS-CoV-2 infection.Cochrane Database Syst Rev. 2022 Jul 22;7(7):CD013705. doi: 10.1002/14651858.CD013705.pub3. Cochrane Database Syst Rev. 2022. PMID: 35866452 Free PMC article.
-
Implementation of a Statewide Fentanyl Possession Law and Opioid-Related Overdose Deaths.JAMA Health Forum. 2025 Aug 1;6(8):e252654. doi: 10.1001/jamahealthforum.2025.2654. JAMA Health Forum. 2025. PMID: 40748547 Free PMC article.
-
Signs and symptoms to determine if a patient presenting in primary care or hospital outpatient settings has COVID-19.Cochrane Database Syst Rev. 2022 May 20;5(5):CD013665. doi: 10.1002/14651858.CD013665.pub3. Cochrane Database Syst Rev. 2022. PMID: 35593186 Free PMC article.
-
Surveillance for Violent Deaths - National Violent Death Reporting System, 50 States, the District of Columbia, and Puerto Rico, 2022.MMWR Surveill Summ. 2025 Jun 12;74(5):1-42. doi: 10.15585/mmwr.ss7405a1. MMWR Surveill Summ. 2025. PMID: 40493548 Free PMC article.
References
-
- Spencer M, Miniño AM, Warner M. Drug overdose deaths in the United States, 2001–2021. NCHS Data Brief. No. 457. December 2022. Accessed August 15, 2024. https://stacks.cdc.gov/view/cdc/122556 - PubMed
-
- CDC WONDER. Centers for Disease Control and Prevention. Accessed September 11, 2024. https://wonder.cdc.gov/
MeSH terms
Substances
Grants and funding
LinkOut - more resources
Full Text Sources
