

From Grotthuss Transfer to Conductivity: Machine Learning Molecular Dynamics of Aqueous KOH
- PMID: 40489230
- PMCID: PMC12183714
- DOI: 10.1021/acs.jpcb.5c03199
From Grotthuss Transfer to Conductivity: Machine Learning Molecular Dynamics of Aqueous KOH
Abstract
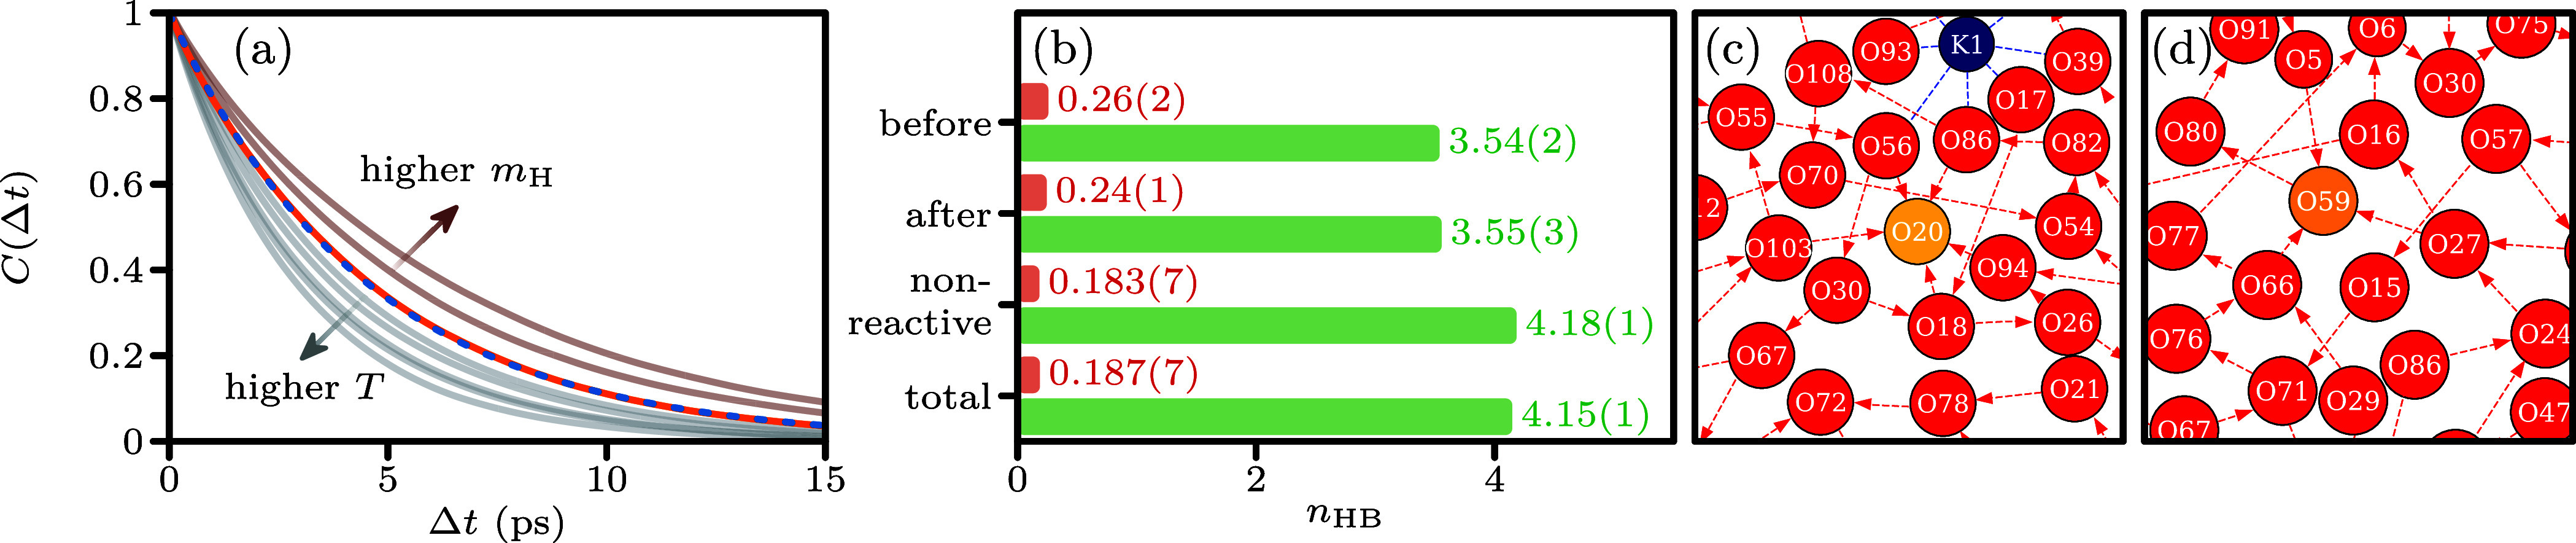
Accurate conductivity predictions of KOH(aq) are crucial for electrolysis applications. OH- is transferred in water by the Grotthuss transfer mechanism, thereby increasing its mobility compared to that of other ions. Classical and ab initio molecular dynamics struggle to capture this enhanced mobility due to limitations in computational costs or in capturing chemical reactions. Most studies to date have provided only qualitative descriptions of the structure during Grotthuss transfer, without quantitative results for the transfer rate and the resulting transport properties. Here, machine learning molecular dynamics is used to investigate 50,000 transfer events. Analysis confirmed earlier works that Grotthuss transfer requires a reduction in accepted and a slight increase in donated hydrogen bonds to the hydroxide, indicating that hydrogen-bond rearrangements are rate-limiting. The computed self-diffusion coefficients and electrical conductivities are consistent with experiments for a wide temperature range, outperforming classical interatomic force fields and earlier AIMD simulations.
Figures


References
-
- Allebrod F., Chatzichristodoulou C., Mollerup P. L., Mogensen M. B.. Electrical Conductivity Measurements of Aqueous and Immobilized Potassium Hydroxide. Int. J. Hydrog. Energy. 2012;37:16505–16514. doi: 10.1016/j.ijhydene.2012.02.088. - DOI
-
- Gilliam R. J., Graydon J. W., Kirk D. W., Thorpe S. J.. A Review of Specific Conductivities of Potassium Hydroxide Solutions for Various Concentrations and Temperatures. Int. J. Hydrog. Energy. 2007;32:359–364. doi: 10.1016/j.ijhydene.2006.10.062. - DOI
-
- Chatenet M., Pollet G., Dekel D., Dionigi F., Deseure J., Millet P., Braatz R. D., Bazant M. Z., Eikerling M., Staffell I.. et al. Water Electrolysis: From Textbook Knowledge to the Latest Scientific Strategies and Industrial Developments. Chem. Soc. Rev. 2022;51:4583–4762. doi: 10.1039/D0CS01079K. - DOI - PMC - PubMed
-
- Kraglund M. R., Aili D., Jankova K., Christensen E., Li Q., Jensen J. O.. Zero-Gap Alkaline Water Electrolysis Using Ion-Solvating Polymer Electrolyte Membranes at Reduced KOH Concentrations. J. Electrochem. Soc. 2016;163:F3125. doi: 10.1149/2.0161611jes. - DOI
-
- Schalenbach M., Zeradjanin A. R., Kasian O., Cherevko S., Mayrhofer K. J. J.. A Perspective on Low-Temperature Water Electrolysis–Challenges in Alkaline and Acidic Technology. Int. J. Electrochem. Sci. 2018;13:1173–1226. doi: 10.20964/2018.02.26. - DOI
LinkOut - more resources
Full Text Sources
