. 2025 Jun 24;19(24):21983-21996.
doi: 10.1021/acsnano.5c00177. Epub 2025 Jun 9.

Exploring the Subcellular Localization and Degradation of Spherical Nucleic Acids Using Fluorescence Lifetime Imaging Microscopy

Affiliations

Exploring the Subcellular Localization and Degradation of Spherical Nucleic Acids Using Fluorescence Lifetime Imaging Microscopy

Steven Narum et al. ACS Nano. .

Abstract

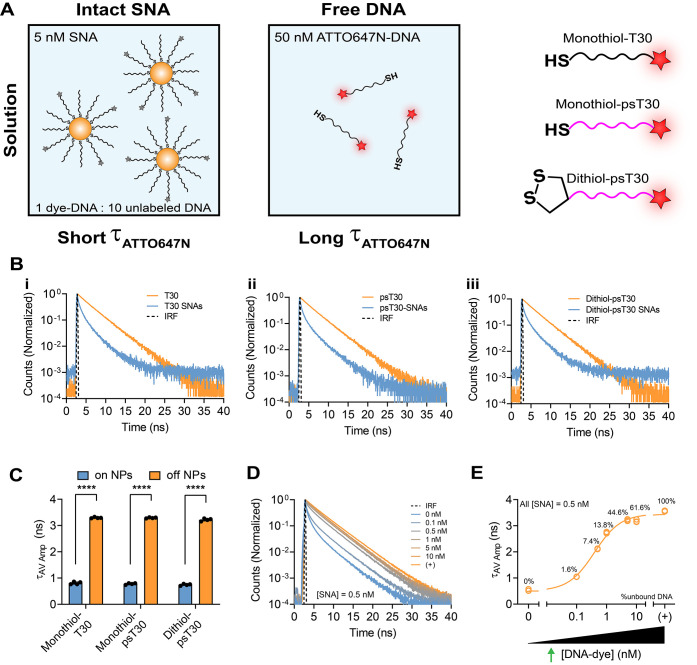
Spherical nucleic acids (SNAs) are a powerful class of nucleic acids with broad applications that span from diagnostic sensors to nanoflares and gene therapeutic agents. SNAs accomplish these varied tasks by taking advantage of the programmability of nucleic acids coupled with enhanced multivalent interactions and improved cellular delivery. Nonetheless, the intracellular trafficking of SNAs remains poorly understood, as conflicting claims in the literature suggest rapid endosomal entrapment and degradation in some cases, while others suggest SNA stability and cytoplasmic escape. One of the challenges in this area is that some of the prior literature claims rely on intensity-based fluorescence measurements, which are indirect and prone to artifacts. Here, we demonstrate the use of fluorescence lifetime imaging microscopy (FLIM) as a tool to provide additional insight into the SNA intracellular fate. We specifically employ FLIM to investigate monothiol and dithiol anchored gold nanoparticle conjugates as well as phosphorothioate backbone-modified SNAs which allow us to characterize the initial stages of SNA degradation within cells. Our work shows that internalized SNAs lose up to 20% of their nucleic acids within 24 h depending on DNase II-activity and thiol-displacement in model cell lines.

Keywords: endocytosis; endosomal entrapment; fluorescence lifetime imaging microscopy (FLIM); nanoparticles; nucleic acids; spherical nucleic acids.


Figures

1
1. Understanding the Degradation Pathway of SNAs
1
1
FLIM measurements reveal distinct lifetime states dependent on NP proximity in solution. A. Schematic showing the solution-based experimental design for intact SNAs (5 nM, left) and free ATTO647N-DNA (50 nM, right). SNA and DNA measurements were conducted for all three DNA structures shown (monothiol-T30, monothiol-psT30, and dithiol-psT30). B. Normalized decay curves of 50 nM: i. monothiol-T30 DNA, ii. monothiol-psT30 DNA, and iii. dithiol psT30 DNA in PBS as soluble ATTO647N-DNA (orange) or bound to SNA (blue). The instrument response function (IRF) is colored black for reference. C. Plot showing the average amplitude lifetime for all three constructs when bound to NP (blue) or off NP (orange). D. Normalized decay curves for a titration of unbound ATTO647N-DNA (0–10 nM) added to a 0.5 nM DNA-AuNP solution in 1× PBS. The positive control (+) is 50 nM DNA only. E. Plot showing the average amplitude lifetime for a titration of unbound ATTO647N-DNA (0–10 nM) to 0.5 nM DNA-AuNP (∼6 nM ATTO647N-DNA) in 1× PBS. The values associated with each data point indicate the percentage of nucleic acid that is soluble which provides a calibration of DNA %unbound. Data were fit to a sigmoidal function. The positive control (+) is ATTO647N-DNA without AuNP. Statistics were conducted using student t tests with p values reported as **** (p < 0.0001). Experiments were measured in triplicate at RT.
2
2
DNA modifications enhance the SNA stability against reducing agents and nucleases. A. Schematic showing SNA dissociation with the addition of 100 μM DTT in solution. ATTO647N dyes are quenched via NSET when proximal to the AuNP core (short lifetimes) and unquenched with thiol displacement due to DTT (long lifetimes). B. Plots showing the average amplitude lifetime for 0.5 nM monothiol-psT30 and dithiol-psT30 SNA constructs after 0, 5, and 30 min incubations at RT in 1× PBS. C. Schematic showing nuclease-mediated degradation (DNase I or II) of SNAs, leading to longer ATTO647N lifetimes in solution. D. Plot showing average amplitude lifetimes for 0.5 nM monothiol-T30 and monothiol-psT30 SNA constructs after treatment with 5U DNase I over a 24 h period in DNase I optimized buffer (10 mM Tris-HCl, 2.5 mM MgCl2, 0.1 mM CaCl2, pH 7.5). E. Plot showing average amplitude lifetimes for 0.5 nM monothiol-T30 and monothiol-psT30 SNA constructs after treatment with 5U DNase II over a 24 h period in DNase II optimized buffer (1× UB4 buffer, 117 mM NaCl, pH 5.0). Statistics were conducted using an unpaired student’s t test (B) or extra sum-of-squares F test (D, E) with p values reported as ns (p > 0.05), *** (p < 0.001), and **** (p < 0.0001). Measurements were conducted in at least triplicate.
3
3
Visualization of SNA intracellular trafficking and dissociation through FLIM. A. Schematic showing experimental design for FLIM timelapse experiments. HeLa or RAW264.7 cells were plated overnight prior to the experiment. A rapid pulse of 5 nM SNAs (monothiol-T30, monothiol-psT30, or dithiol-psT30 DNA) was introduced to cells and imaged over a 24 h time frame using FLIM. B. Lifetime confocal microscopy images of SNA distribution in live HeLa cells over 24 h for all three SNA constructs (5 min, 1, 2, 4, 8, 16, and 24 h). Blue-green colors represent short lifetime values, and red-yellow colors represent long lifetime values for ATTO647N-labeled DNA. Scale bar represents 20 μm. C. Lifetime confocal microscopy images of SNA distribution in live RAW264.7 macrophages over 24 h for all three SNA constructs (5 min, 1, 2, 4, 8, 16, and 24 h). Blue-green colors represent short lifetime values, and red-yellow colors represent long lifetime values for ATTO647N-labeled DNA. Scale bar represents 20 μm. D, E. Plot showing the average amplitude-weighted lifetimes for monothiol-T30, monothiol-psT30, and dithiol-psT30 SNAs in HeLa cells (D) and RAW264.7 cells (E). Lifetimes were quantified by using a biexponential reconvolution model. Data were fit using a one-phase association model with the plateau constrained to the free ATTO647N-DNA lifetime in solution (τav amp = 3.29 n.s.). Repeated measures one-way ANOVA tests were conducted to determine significance with posthoc Tukey’s tests upon significance. p values are reported as ns (p > 0.05), ** (p < 0.01), and **** (p < 0.0001). All measurements were conducted in at least biological triplicates with multiple cells collected for each data point as technical replicates. Cells were grown in 5% CO2, 100% humidity, and 37 °C.
4
4
siRNA-mediated knockdown of DNase II improves the SNA circulation time. A. Schematic of the DNase II knockdown experimental design. HeLa cells are plated overnight and are transfected with 100 nM DNase II siRNA for 48 h. Next, cells are pulse treated with 5 nM SNA (monothiol-T30, monothiol-psT30, or dithiol-psT30) for 5 min, washed, and then imaged over a 24 h time frame using FLIM. B. Quantification of DNase II mRNA knockdown using RT-qPCR for wild-type HeLa cells (nontreated), 100 nM negative control siRNA, and 100 nM DNase II siRNA transfected using oligofectamine for 24 h. Relative expression is determined through the ΔΔCt method with the nontreated wild-type group as 100% expression and HPRT-1 as the housekeeping gene. C. Fluorescent Western blot images for wild-type HeLa cells, DNase II siRNA treated cells (100 nM), and negative control siRNA treated cells (100 nM) after 48 h. Primary anti-DNase II and anti-β-actin antibodies are labeled with Alexa Fluor Plus 647 and Alexa Fluor Plus 488 secondary antibodies, respectively. D. Representative lifetime confocal microscopy images for all three SNA constructs in live HeLa cells across 24 h incubation after treatment with 100 nM DNase II siRNA for 48h. Blue-green colors represent short lifetime values, and red-yellow colors represent long lifetime values for ATTO647N-labeled DNA. E–G. Plots showing the average amplitude lifetimes for DNase II siRNA-treated and wild-type HeLa cells after incubation with monothiol-T30 (E), monothiol-psT30 (F), and dithiol-psT30 (G) SNAs. Dashed horizontal lines indicate the lifetime values for 100% unbound and 100% bound nucleic acids, as derived from Figure . Data were fit using a one-phase association model. Statistics were conducted using an extra sum-of-squares F test with p values reported as ns (p > 0.05) and **** (p < 0.0001). All measurements were conducted in at least biological triplicates with multiple cells collected for each data point as technical replicates. Cells were grown in 5% CO2, 100% humidity, and 37 °C. Scale bar represents 20 μm.
5
5
Endosomal compartmentalization reveals distinct lifetimes with two-color FLIM measurements. A. Schematic representing the lifetime shift with endosomal maturation from early endosomes (blue, short lifetimes) to late endosomes (green, middle lifetimes) to lysosomes (red, long lifetimes). B. Schematic showing the image collection process. Images are captured using two lasers (640 and 485 nm) that are separated by a dichroic mirror into two detector channels. Data are analyzed by thresholding pixels from channel 1 (Alexa Fluor Plus 488) to create a region of interest (ROI) that only contains endosomal signal. This ROI is applied to channel 2 (ATTO647N-SNA) signal and quantified using a biexponential reconvolution fitting model to determine the average amplitude lifetime. C–E. Representative lifetime confocal microscopy images for early endosomes (EEA1, C), late endosomes (Rab7, D), and lysosomes (LAMP1, E) in HeLa cells after a 5 min pulse of 5 nM SNA (monothiol-T30 shown) with 30 min, 8 h, and 24 h incubations. SNA signal (channel 2: ATTO647N), endosomal stain (channel 1: Alexa Fluor Plus 488), and overlaid signal (ROI from channel 1 onto channel 2) images are shown from left to right. Blue-green colors represent short lifetime values, and red-yellow colors represent long lifetime values for ATTO647N-labeled DNA. Note: these experiments require fixation and permeabilization to label endosomes in HeLa cells unlike previous figures. Scale bars represent 20 μm. F–H. Plots showing the average amplitude lifetimes of all three SNA constructs (monothiol-T30 in blue, monothiol-psT30 in yellow, and dithiol-psT30 in green) for EEA1 (F), Rab7 (G), and LAMP1 (H) staining over a 24 h time frame. Dashed horizontal lines indicate the lifetime values for 100% unbound and 100% bound nucleic acids as derived from Figure . Data are fit using a linear regression with the 95% confidence interval shown for each SNA construct. The number of cells analyzed at each time point in F, G, and H were n > 10 cells for each replicate. I. Super plot showing the average amplitude lifetimes for EEA1, Rab7, and LAMP1 staining in HeLa cells with all time points grouped together. Monothiol-T30 (blue circles), monothiol-psT30 (yellow squares), and dithiol-psT30 (green triangle) are shown with the large shapes representing the mean across the 24 h timelapse and smaller shapes representing each individual data point. J–L. Plots showing the percentage of masked fluorescence intensity over total fluorescence intensity were obtained using endosomal stains EEA1 (J), Rab7 (K), and LAMP1 (L). Note: the same masks for F–H were used for J–L. For F–I, statistics were conducted using a repeated measures one-way ANOVA with posthoc Tukey’s tests upon significance. p values are reported as ns (p > 0.05), *** (p < 0.001), and **** (p < 0.0001). The number of cells analyzed at each time point in J, K, and L were n > 10 cells for each replicate. For I, statistical comparisons were conducted using each SNA mean (n = 3) rather than individual data points (n > 40). Cells were grown in 5% CO2, 100% humidity, and 37 °C. All experiments were conducted in biological triplicate.

Similar articles

References

    1. Sharma R., Dong Y., Hu Y., Ma V. P., Salaita K.. Gene Regulation Using Nanodiscs Modified with HIF-1-alpha Antisense Oligonucleotides. Bioconjugate Chem. 2022;33(2):279–293. doi: 10.1021/acs.bioconjchem.1c00505. - DOI - PMC - PubMed
    1. Sharma R., Narum S., Liu S., Dong Y., Baek K. I., Jo H., Salaita K.. Nanodiscoidal Nucleic Acids for Gene Regulation. ACS Chem. Biol. 2023;18(11):2349–2367. doi: 10.1021/acschembio.3c00038. - DOI - PMC - PubMed
    1. Guan C., Chernyak N., Dominguez D., Cole L., Zhang B., Mirkin C. A.. RNA-Based Immunostimulatory Liposomal Spherical Nucleic Acids as Potent TLR7/8 Modulators. Small. 2019;15(43):e1903338. doi: 10.1002/smll.201903338. - DOI - PubMed
    1. Radovic-Moreno A. F., Chernyak N., Mader C. C., Nallagatla S., Kang R. S., Hao L., Walker D. A., Halo T. L., Merkel T. J., Rische C. H.. et al. Immunomodulatory spherical nucleic acids. Proc. Int. Acad. Sci. 2015;112(13):3892–3897. doi: 10.1073/pnas.1502850112. - DOI - PMC - PubMed
    1. Huang Z., Ma X., Jiang F., Wang R., Wu Z., Lu Y.. Dual Spatially Localized DNA Walker for Fast and Efficient RNA Detection. Nano Lett. 2023;23(13):6042–6049. doi: 10.1021/acs.nanolett.3c01349. - DOI - PubMed

LinkOut - more resources