. 2026 Jan 1;21(1):333-345.
doi: 10.4103/NRR.NRR-D-24-00044. Epub 2024 Sep 6.

Neuroserpin alleviates cerebral ischemia-reperfusion injury by suppressing ischemia-induced endoplasmic reticulum stress

Affiliations

Neuroserpin alleviates cerebral ischemia-reperfusion injury by suppressing ischemia-induced endoplasmic reticulum stress

Yumei Liao et al. Neural Regen Res. .

Abstract

JOURNAL/nrgr/04.03/01300535-202601000-00037/figure1/v/2025-06-09T151831Z/r/image-tiff Neuroserpin, a secreted protein that belongs to the serpin superfamily of serine protease inhibitors, is highly expressed in the central nervous system and plays multiple roles in brain development and pathology. As a natural inhibitor of recombinant tissue plasminogen activator, neuroserpin inhibits the increased activity of tissue plasminogen activator in ischemic conditions and extends the therapeutic windows of tissue plasminogen activator for brain ischemia. However, the neuroprotective mechanism of neuroserpin against ischemic stroke remains unclear. In this study, we used a mouse model of middle cerebral artery occlusion and oxygen-glucose deprivation/reperfusion-injured cortical neurons as in vivo and in vitro ischemia-reperfusion models, respectively. The models were used to investigate the neuroprotective effects of neuroserpin. Our findings revealed that endoplasmic reticulum stress was promptly triggered following ischemia, initially manifesting as the acute activation of endoplasmic reticulum stress transmembrane sensors and the suppression of protein synthesis, which was followed by a later apoptotic response. Notably, ischemic stroke markedly downregulated the expression of neuroserpin in cortical neurons. Exogenous neuroserpin reversed the activation of multiple endoplasmic reticulum stress signaling molecules, the reduction in protein synthesis, and the upregulation of apoptotic transcription factors. This led to a reduction in neuronal death induced by oxygen/glucose deprivation and reperfusion, as well as decreased cerebral infarction and neurological dysfunction in mice with middle cerebral artery occlusion. However, the neuroprotective effects of neuroserpin were markedly inhibited by endoplasmic reticulum stress activators thapsigargin and tunicamycin. Our findings demonstrate that neuroserpin exerts neuroprotective effects on ischemic stroke by suppressing endoplasmic reticulum stress.

Keywords: endoplasmic reticulum stress; ischemia-reperfusion injury; neuron; neuronal apoptosis; neuroprotection; neuroserpin; protein synthesis; secretory protein; stroke; transcriptomic analysis.


Conflict of interest statement

Conflicts of interest: No potential conflicts of interest.

Figures

Figure 1
Figure 1
Cerebral I/R induces transient activation of ER stress transmembrane sensors, followed by apoptosis. (A) Schematic representation of the timeline of the experimental procedure. Mice were subjected to sham/MCAO for 1.5 hours followed by recovery/reperfusion. Brain tissues were collected at various time points during reperfusion for Western blotting, and brain infarction and neurological evaluation were performed after 24 hours recovery/reperfusion. (B) Triphenyl-tetrazolium chloride–stained cerebral coronal sections from representative brains, collected at 24 hours after reperfusion. The infarcted area is shown in white, and the normal area is shown in red. (C) Statistical analysis of the infarct volumes (n = 5). ****P < 0.0001, I/R group vs. sham group, unpaired t-test. (D) Statistical analysis of the neurological scores 24 hours after reperfusion by Zea-Longa test (n = 5). ****P < 0.0001, I/R group vs. sham group, Mann–Whitney U test. (E–J) The ischemic brain tissues were collected after 1.5 hours of MCAO (reperfusion 0 hours) or 1, 3, 6, 12, and 24 hours after reperfusion. The tissues from the sham group were collected at 1.5 hours after the sham surgery. (E) Representative western blot images of p-eIF2α, p-IRE1, ATF6, ATF4, and CHOP at different time points (n = 3) after reperfusion. (F–J) Quantifications of the normalized levels of p-eIF2α/eIF2α (F), p-IRE1/IRE1 (G), ATF6/GAPDH (H), ATF4/GAPDH (I), and CHOP/GAPDH (J). *P < 0.05, **P < 0.01, ***P < 0.001, ****P < 0.0001, I/R group vs. sham group, one-way analysis of variance followed by Dunnett’s multiple comparison test. Data are shown as mean ± SEM. ATF: Activating transcription factor; CHOP: CCAAT/enhancer binding protein homologous protein; eIF2α: eukaryotic translation initiation factor 2α; ER: endoplasmic reticulum; GAPDH: glyceraldehyde-3-phosphate dehydrogenase; I/R: cerebral ischemia-reperfusion; IRE1: inositol requiring enzyme 1; MCAO: middle cerebral artery occlusion; p-: phosphorylated-; TTC: 2,3,5-triphenyl tetrazolium chloride.
Figure 2
Figure 2
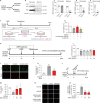
OGD/R induces early activation of ER stress sensors followed by apoptosis in cultured cortical neurons, which is ameliorated by ER stress inhibitors. (A) Schematic representation of the timeline of the experimental procedures. Cortical neurons (7 DIV) were cultured in normal conditions (Control group) or exposed to oxygen/glucose deprivation for 4 hours followed by reperfusion (OGD/R group). Cell lysates were collected at various time points for Western blotting, and cell viability was evaluated after 24 hours reperfusion. (B) The cell viability of primary cortical neurons after OGD/R 24 hours was detected by MTT assay. Cortical neurons (7 DIV) under standard culture conditions were used as the control group (n = 3). **P < 0.01, vs. control, unpaired t-test. (C) Cell lysates from the OGD/R group were collected at different time points (0–24 hours) after reperfusion. For the control group, cell lysates were collected at the same time corresponding to 0 hours reperfusion of OGD/R group. Levels of ER stress sensors, protein synthesis, and apoptosis-related proteins were examined by western blot analysis. (D–K) Quantifications of the normalized levels of p-PERK/PERK (D, n = 4), p-eIF2α/eIF2α (E, n = 3), p-IRE1/IRE1 (F, n = 3), ATF6 (G, n = 3), puromycin (H, n = 3), ATF4 (I, n = 3), CHOP (J, n = 3), and cleaved-caspase-3 (K, n = 3). GAPDH and α-tubulin served as the loading control. *P < 0.05, **P < 0.01, ***P < 0.001, ****P < 0.0001, vs. control, one-way analysis of variance followed by Dunnett’s multiple comparison test. (L) A schematic illustration of the application of ER stress inhibitors, sodium 4-PBA or Sal, to neurons 1 hour before OGD and during OGD (−5 to 0 hours). (M, N) MTT assay was performed to evaluate cell viability of neurons treated with 4-PBA or Sal (n = 3). ****P < 0.0001, OGD/R vs. control; #P < 0.05, ##P < 0.01, 4-PBA (50 or 100 µM) or Sal (25 or 100 µM) vs. OGD/R, unpaired t-test. Data are shown as mean ± SEM. 4-PBA: Sodium 4-phenylbutyrate; ATF: activating transcription factor; CHOP: CCAAT/enhancer binding protein homologous protein; C-Casp-3: cleaved-caspase-3; DIV: day in vitro; eIF2α: eukaryotic translation initiation factor 2α; ER: endoplasmic reticulum; GAPDH: glyceraldehyde-3-phosphate dehydrogenase; IRE1: inositol requiring enzyme 1; MTT: 3-(4,5-Dimethyl-2-thiazolyl)-2,5-diphenyl-2H-tetrazolium bromide; OGD: oxygen-glucose deprivation; OGD/R: oxygen-glucose deprivation/reperfusion; p-: phosphorylated-; PERK: double-stranded RNA-activated protein kinase-like ER kinase; Sal: salubrinal.
Figure 3
Figure 3
Secreted neuroserpin ameliorates cell death in cultured cortical neurons. (A) Schematic of the experiment: cell lysates and media of cortical neurons (7 DIV) were collected separately and analyzed individually for NSP levels after 4 hours of OGD. (B) Representative western blot images showing the cellular and secreted levels of NSP. (C) Quantifications of NSP protein levels in cell lysate or medium from primary cortical neurons after 4 hours of OGD by Western blot assay (n = 6). ****P < 0.0001, OGD 4 h vs. control, unpaired t-test. (D) Quantifications of the cellular NSP mRNA level in cell lysate from primary cortical neurons after 4 hours of OGD by quantitative polymerase chain reaction (n = 7). ****P < 0.0001, OGD 4 h vs. control, unpaired t-test. (E) Neuroserpin mRNA levels in brain tissues of sham and MCAO mice by quantitative polymerase chain reaction (n = 3 mice per group). **P < 0.01, control vs. MCAO, unpaired t-test. (F) A diagram showing the conditional medium treatment procedure. Conditioned medium was collected from normal neurons of the same stage (7 DIV) and added to OGD-injured neurons for the reperfusion phase. To neutralize NSP in the medium, anti-NSP antibody (α-NSP Ab; 50 ng for 20,000 cells) was added in the conditional medium. (G) Cell viability was measured by MTT assay in OGD/R neurons cultured in conditioned medium with or without α-NSP Ab (n = 3). **P < 0.01, OGD/R vs. control; #P < 0.05, OGD/R + conditioned medium vs. OGD/R; $P < 0.05, OGD/R + conditioned medium + α-NSP Ab vs. OGD/R + conditioned medium, unpaired t-test. (H) A diagram showing the recombinant NSP treatment procedure. NSP (1−20 ng/mL) was added to neurons 4 hours before OGD and during OGD and after reperfusion. (I) Cell viability of neurons treated with different concentrations of NSP was determined by MTT assay (n = 4). ****P < 0.0001, OGD/R vs. control; #P < 0.05, OGD/R + NSP vs. OGD/R, unpaired t-test. (J) Representative images of live and dead neurons, treated with 20 ng/mL NSP, measured by the live and death cell assay. Scale bar: 200 µm. (K) Quantification of the percentage of dead cells (n = 3). ***P < 0.001, OGD/R vs. control; ##P < 0.01, OGD/R + NSP vs. OGD/R, unpaired t-test. (L) A diagram showing the experimental procedure: NSP (50 and 100 ng/mL) was added to neurons immediately after OGD. (M) Cell viability of neurons treated with different concentrations of NSP were determined by MTT assay (n = 3). ****P < 0.0001, OGD/R vs. control; #P < 0.05, OGD/R + NSP vs. OGD/R, unpaired t-test. (N) Representative TUNEL and DAPI staining in OGD/R-injured neurons treated with NSP (20 and 100 ng/mL). Scale bar: 100 µm. (O) Number of TUNEL-positive cells in each group was quantified and normalized to that of the control group (n = 3). **P < 0.01, OGD/R vs. control; ##P < 0.01, OGD/R + NSP vs. OGD/R, unpaired t-test. Data are shown as mean ± SEM. α-NSP Ab: Anti-NSP antibody; DAPI: 4′,6-diamidino-2-phenylindole; DIV: day in vitro; GAPDH: glyceraldehyde-3-phosphate dehydrogenase; MCAO: middle cerebral artery occlusion; MTT: 3-(4,5-dimethyl-2-thiazolyl)-2,5-diphenyl-2H-tetrazolium bromide; NSP: neuroserpin; OGD: oxygen-glucose deprivation; OGD/R: oxygen-glucose deprivation/reperfusion; TUNEL: terminal deoxynucleotidyl transferase dUTP nick end labeling.
Figure 4
Figure 4
Neuroserpin inhibits ER stress–mediated signaling transduction induced by OGD/R. (A) Schematic representation of the timing of the experimental procedures. Neuroserpin (NSP; 20 ng/mL) was added to cortical neurons (7 DIV) 4 hours before OGD and during OGD, followed by reperfusion. Cell lysates were collected at the indicated time points of reperfusion for the examination of ER stress signaling molecules. (B) Representative western blots showing phosphorylated and total levels of ER stress sensors and apoptosis-related proteins. (C) Representative western blots showing levels of puromycin. (D–K) Quantitative analysis of the normalized p-PERK/PERK (D, n = 3), p-eIF2α/eIF2α (E, n = 3), p-IRE1/IRE1 (F, n = 3), ATF6 (G, n = 3), puromycin (H, n = 3), ATF4 (I, n = 5), CHOP (J, n = 5), and cleaved-caspase-3 (K, n = 4). GAPDH and α-tubulin were used as loading controls. **P < 0.01, ***P < 0.001, OGD/R vs. control; #P < 0.05, ##P < 0.01, OGD/R + NSP vs. OGD/R, unpaired t-test. Data are shown as mean ± SEM. ATF: Activating transcription factor; CHOP: CCAAT/enhancer binding protein homologous protein; C-Casp-3: cleaved-caspase-3; DIV: day in vitro; eIF2α: eukaryotic translation initiation factor 2α; ER: endoplasmic reticulum; GAPDH: glyceraldehyde-3-phosphate dehydrogenase; IRE1: inositol requiring enzyme 1; i.c.v.: intracerebroventricular; NSP: neuroserpin; OGD: oxygen-glucose deprivation; OGD/R: oxygen-glucose deprivation/reperfusion; p-: phosphorylated-; PERK: double-stranded RNA-activated protein kinase-like ER kinase.
Figure 5
Figure 5
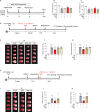
Neuroprotective effect of neuroserpin is dependent on the suppression of ER stress in vitro and in vivo. (A) Schematic representation of the timing of in vitro experimental procedures. NSP (20 ng/mL) with or without the ER stress activators TG (100 nM) or TM (50 µM) was added to cultures of cortical neurons (7 DIV) 4 hours before OGD and during OGD, followed by reperfusion. (B, C) MTT assay was performed to determine OGD/R-injured neurons treated with NSP and TG (b) or TM (c) (n = 3). ***P < 0.001, OGD/R vs. control; #P < 0.05, OGD/R + NSP vs. OGD/R; $P < 0.05, OGD/R + NSP + TG/TM vs. OGD/R + NSP, unpaired t-test. (D) The schematic representation of the timing of in vivo experimental procedures. TM (0.5 mg/kg) was i.p. administrated to adult mice 2 days before MCAO, and NSP (100 ng) was i.c.v injected 30 minutes before MCAO; MCAO lasted for 1.5 hours followed by reperfusion for 24 hours. (E) TTC-stained coronal brain slices from representative brains. (F) Quantitative analysis of infarct volumes (n = 9 for sham group, n = 6 for I/R group, n = 8 for I/R + TM group, n = 11 for I/R + NSP group, n = 6 for I/R + NSP + TM group). ****P < 0.0001, I/R vs. sham; #P < 0.05, I/R + NSP vs. I/R; $P < 0.05, I/R + NSP + TM vs. I/R + NSP, unpaired t-test. (G) Quantitative analysis of the neurological function by Zea-Longa test (n = 9 for sham, n = 6 for I/R, n = 7 for I/R + TM, n = 9 for I/R + NSP, n = 11 for I/R + NSP + TM). ****P < 0.0001, I/R vs. sham; ##P < 0.01, I/R + NSP vs. I/R, unpaired t-test. (H) Schematic of the experimental procedure in which NSP was treated after MCAO. TM (0.5 mg/kg) was i.p. administrated to adult mice 2 days before MCAO, and NSP (500 ng) was i.c.v injected immediately after ischemia. (I) TTC-stained coronal brain slices from representative brains. (J) Quantitative analysis of infarct volumes (n = 6). ***P < 0.001, I/R vs. Sham; #P < 0.05, I/R + NSP vs. I/R; $P < 0.05, I/R + NSP + TM vs. I/R + NSP, unpaired t-test. (K) Quantitative analysis of the neurological function by Zea-Longa test (n = 6). ****P < 0.0001, I/R vs. sham; ####P < 0.0001, I/R + NSP vs. I/R; $$$P < 0.001, I/R + NSP + TM vs. I/R + NSP, unpaired t-test. All data are shown as mean ± SEM. ACSF: Artificial cerebrospinal fluid; DIV: day in vitro; ER: endoplasmic reticulum; i.c.v: intracerebroventricular; i.p.: intraperitoneally; I/R: cerebral ischemia-reperfusion; MCAO: middle cerebral artery occlusion; MTT: 3-(4,5-dimethyl-2-thiazolyl)-2,5-diphenyl-2H-tetrazolium bromide; NSP: neuroserpin; OGD: oxygen-glucose deprivation; OGD/R: OGD/reperfusion; TG: thapsigargin; TM: tunicamycin; TTC: 2,3,5-triphenyl tetrazolium chloride.
Figure 6
Figure 6
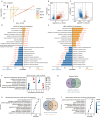
Transcriptomic analysis reveals that neuroserpin rescues ER stress and neuronal apoptosis in MCAO mice. (A) PCA of different groups (sham group, n = 5; MCAO group, n = 3; NSP treated group, n = 5). (B) Volcano plots of DEGs between MCAO and sham groups (MCAO vs. sham). (C) Volcano plots of DEGs between NSP and MCAO groups (NSP vs. MCAO). For B and C, gray represents no significant change in expression, red represents upregulation, and blue represents downregulation. The dotted horizontal line represents an adjusted P value of 0.05. The dotted vertical line represents that fold change reaches 2-fold. (D) GO enrichment analysis of DEGs (MCAO vs. sham). (E) GO enrichment analysis of DEGs (NSP vs. MCAO). In D and E, the yellow and blue bars represent the selected enriched GO terms from the upregulated and downregulated DEGs, respectively. Bar length represents the gene ratio. Red numbers are the adjusted P values. (F) The dot plot shows the selected enriched gene sets by GSEA (MCAO vs. sham and NSP vs. MCAO). Dots in blue and red represent downregulated and upregulated gene sets, respectively. The size of dots represents the adjusted P value. (G, H) Venn diagram shows the genes that were reversely regulated by NSP. (G) Upregulated DEGs in MCAO but downregulated DEGs in NSP. (H) GO enrichment analysis of reversed DEGs from G. (I) Downregulated DEGs in MCAO and upregulated DEGs in NSP. (J) GO enrichment analysis of reversed DEGs from I. The color depth of dots represents the adjusted P value. DEGs: Differentially expressed genes; GO: gene ontology; GSEA: Gene Set Enrichment Analysis; MCAO: middle cerebral artery occlusion; NSP: neuroserpin; PCA: principal components analysis.

Similar articles

Cited by

References

    1. Adorjan I, Tyler T, Bhaduri A, Demharter S, Finszter CK, Bako M, Sebok OM, Nowakowski TJ, Khodosevich K, Møllgård K, Kriegstein AR, Shi L, Hoerder-Suabedissen A, Ansorge O, Molnár Z. Neuroserpin expression during human brain development and in adult brain revealed by immunohistochemistry and single cell RNA sequencing. J Anat. 2019;235:543–554. - PMC - PubMed
    1. Almanza A, et al. Endoplasmic reticulum stress signalling - from basic mechanisms to clinical applications. FEBS J. 2019;286:241–278. - PMC - PubMed
    1. Badiola N, Penas C, Miñano-Molina A, Barneda-Zahonero B, Fadó R, Sánchez-Opazo G, Comella JX, Sabriá J, Zhu C, Blomgren K, Casas C, Rodríguez-Alvarez J. Induction of ER stress in response to oxygen-glucose deprivation of cortical cultures involves the activation of the PERK and IRE-1 pathways and of caspase-12. Cell Death Dis. 2011;2:e149. - PMC - PubMed
    1. Barker-Carlson K, Lawrence DA, Schwartz BS. Acyl-enzyme complexes between tissue-type plasminogen activator and neuroserpin are short-lived in vitro. J Biol Chem. 2002;277:46852–46857. - PubMed
    1. Boyce M, Bryant KF, Jousse C, Long K, Harding HP, Scheuner D, Kaufman RJ, Ma D, Coen DM, Ron D, Yuan J. A selective inhibitor of eIF2alpha dephosphorylation protects cells from ER stress. Science. 2005;307:935–939. - PubMed