

Small-area spatio-temporal analysis of cancer risk to support effective and equitable cancer prevention
- PMID: 40489505
- PMCID: PMC12148161
- DOI: 10.1371/journal.pone.0325523
Small-area spatio-temporal analysis of cancer risk to support effective and equitable cancer prevention
Abstract
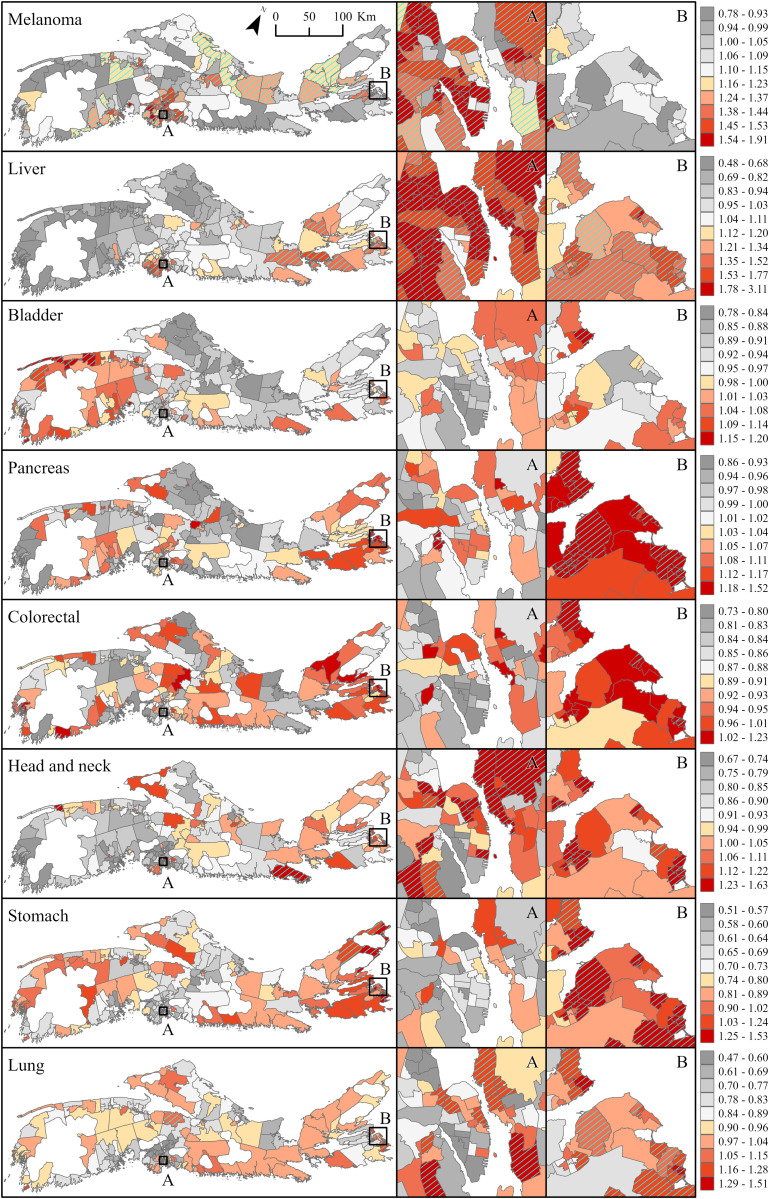
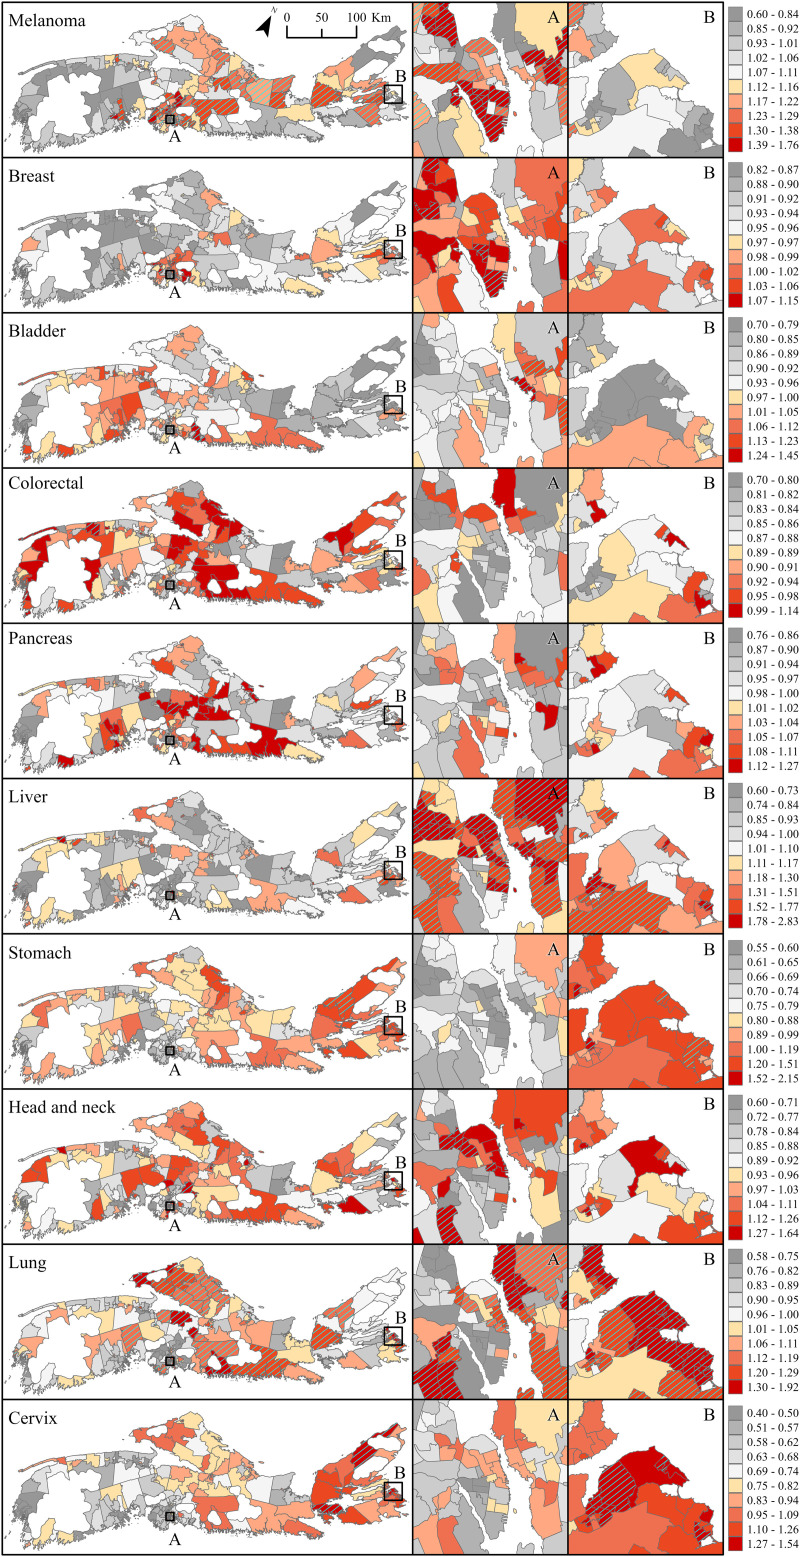
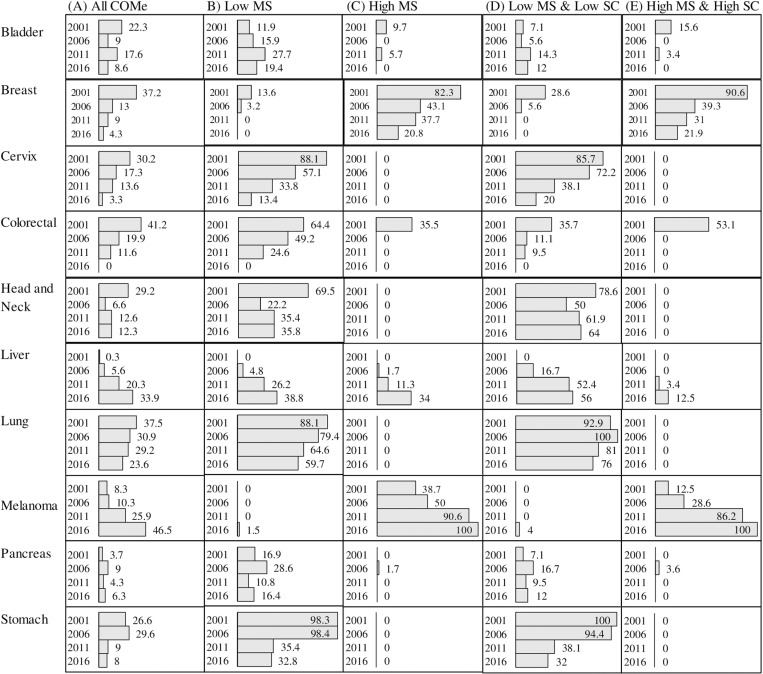
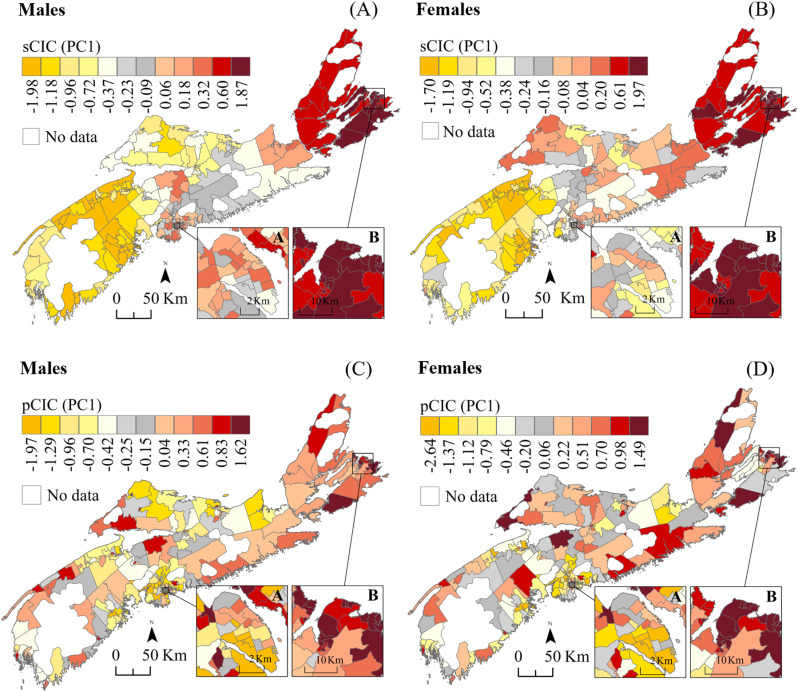
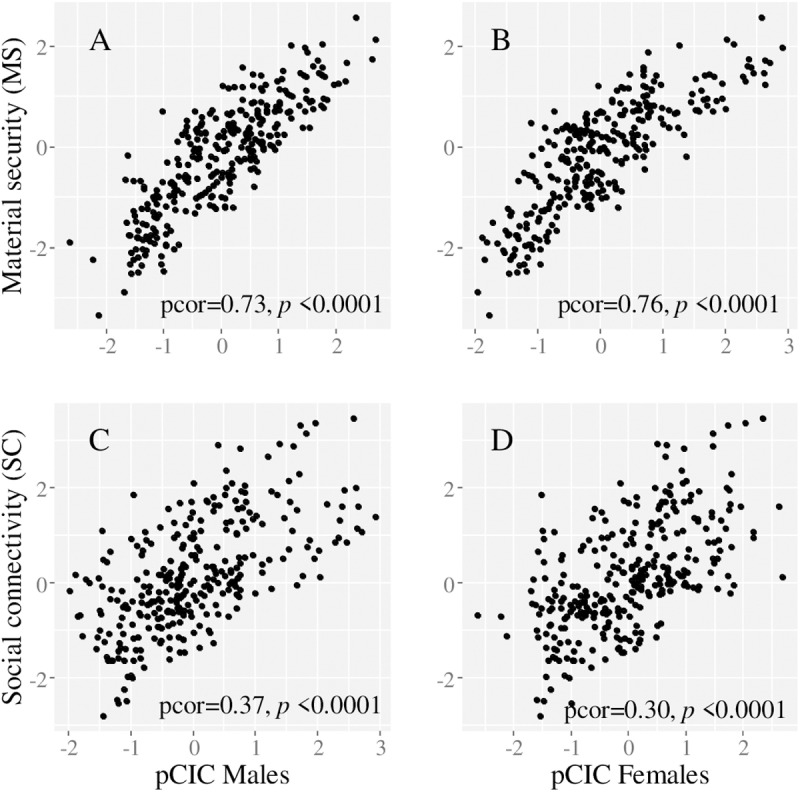
Cancer is rapidly increasing worldwide and urgent global action towards cancer control is required. Consistent with global trends, Canada is expected to experience a near doubling in new cases and cancer deaths between 2020-2040; population growth and ageing being the primary drivers. The projected increased cancer incidence and its associated costs is expected to further exacerbate socioeconomic inequities. Focused actions to prevent cancer, to detect it earlier when more treatable, and, to lower the risk of recurrence, must be prioritized. Almost half of all cancers are preventable, caused by risk factors that are potentially avoidable and modifiable. Integrating cancer prevention with care-based models is necessary and represents the most cost-effective and sustainable approach to control cancer. To be effective, prevention efforts must consider the cancers impacting local populations and understand how community and individual factors interact within the spatial and temporal contexts in which people live. This study is part of the Nova Scotia Community Cancer Matrix project which profiles the cancers impacting communities over time; measuring associations between cancer and socioeconomic status (SES); and determining how the joint spatial distribution of cancers can be used to address inequities, identify priority populations and strengthen prevention efforts. Using Bayesian inference to model spatio-temporal variations in 58,206 cases diagnosed in 301 communities between 2001-2017, across 10 preventable cancer types, we report significant disparities in cancer risk across communities based on sex and community SES. The work highlights the utility of small-area mapping to identify at-risk communities and understand how community-SES impacts risk. It also uncovers significant inequities rooted in the differential distribution of material and social capacity, operating beyond the control of individuals. The approach is implementable to other regions to inform and strengthen prevention efforts aiming at reducing the burden of cancer or that of other diseases.
Copyright: © 2025 Saint-Jacques et al. This is an open access article distributed under the terms of the Creative Commons Attribution License, which permits unrestricted use, distribution, and reproduction in any medium, provided the original author and source are credited.
Conflict of interest statement
The authors have declared that no competing interests exist.
Figures
Similar articles
-
The Nova Scotia Community Cancer Matrix: A geospatial tool to support cancer prevention.Soc Sci Med. 2023 Aug;330:116038. doi: 10.1016/j.socscimed.2023.116038. Epub 2023 Jun 21. Soc Sci Med. 2023. PMID: 37390806
-
Small-area spatio-temporal analyses of bladder and kidney cancer risk in Nova Scotia, Canada.BMC Public Health. 2016 Feb 19;16:175. doi: 10.1186/s12889-016-2767-9. BMC Public Health. 2016. PMID: 26895703 Free PMC article.
-
Folic acid supplementation and malaria susceptibility and severity among people taking antifolate antimalarial drugs in endemic areas.Cochrane Database Syst Rev. 2022 Feb 1;2(2022):CD014217. doi: 10.1002/14651858.CD014217. Cochrane Database Syst Rev. 2022. PMID: 36321557 Free PMC article.
-
The Minderoo-Monaco Commission on Plastics and Human Health.Ann Glob Health. 2023 Mar 21;89(1):23. doi: 10.5334/aogh.4056. eCollection 2023. Ann Glob Health. 2023. PMID: 36969097 Free PMC article. Review.
-
A small-area analysis of inequalities in chronic disease prevalence across urban and non-urban communities in the Province of Nova Scotia, Canada, 2007-2011.BMJ Open. 2014 May 13;4(5):e004459. doi: 10.1136/bmjopen-2013-004459. BMJ Open. 2014. PMID: 24823673 Free PMC article.
References
-
- Wild C, Weiderpass E, Stewart B. World cancer report: cancer research for cancer prevention. 2020. https://publications.iarc.fr/Non-Series-Publications/World-Cancer-Report... - PubMed
-
- Global Burden of Disease 2019 Cancer Collaboration, Kocarnik JM, Compton K, Dean FE, Fu W, Gaw BL, et al. Cancer incidence, mortality, years of life lost, years lived with disability, and disability-adjusted life years for 29 cancer groups from 2010 to 2019: a systematic analysis for the global burden of disease study 2019. JAMA Oncol. 2022;8(3):420–44. doi: 10.1001/jamaoncol.2021.6987 - DOI - PMC - PubMed
-
- Xie L, Semenciw R, Mery L. Cancer incidence in Canada: trends and projections (1983–2032). Health Promot Chronic Dis Prev Can. 2015;35:1–187. - PubMed
MeSH terms
LinkOut - more resources
Full Text Sources
Medical
