. 2025 Jun 9;21(6):e1013227.
doi: 10.1371/journal.ppat.1013227. eCollection 2025 Jun.

Multiple introductions of equine influenza virus into the United Kingdom resulted in widespread outbreaks and lineage replacement

Affiliations

Multiple introductions of equine influenza virus into the United Kingdom resulted in widespread outbreaks and lineage replacement

Laura Mojsiejczuk et al. PLoS Pathog. .

Abstract

Influenza A viruses (IAVs) are prime examples of emerging viruses in humans and animals. IAV circulation in domestic animals poses a pandemic risk as it provides new opportunities for zoonotic infections. The recent emergence of H5N1 IAV in cows and subsequent spread over multiple states within the USA, together with reports of spillover infections in humans, cats and mice highlight this issue. The horse is a domestic animal in which an avian-origin IAV lineage has been circulating for >60 years. In 2018/19, a Florida Clade 1 (FC1) virus triggered one of the largest epizootics recorded in the UK, which led to the replacement of the Equine Influenza Virus (EIV) Florida Clade 2 (FC2) lineage that had been circulating in the country since 2003. We integrated geographical, epidemiological, and virus genetic data to determine the virological and ecological factors leading to this epizootic. By combining newly-sequenced EIV complete genomes derived from UK outbreaks with existing genomic and epidemiological information, we reconstructed the nationwide viral spread and analysed the global evolution of EIV. We show that there was a single EIV FC1 introduction from the USA into Europe, and multiple independent virus introductions from Europe to the UK. At the UK level, three English regions (East, West Midlands, and North-West) were the main sources of virus during the epizootic, and the number of affected premises together with the number of horses in the local area were found as key predictors of viral spread within the country. At the global level, phylogeographic analysis evidenced a source-sink model for intercontinental EIV migration, with a source population evolving in the USA and directly or indirectly seeding viral lineages into sink populations in other continents. Our results provide insight on the underlying factors that influence IAV spread in domestic animals.


Conflict of interest statement

The authors have declared that no competing interests exist.

Figures
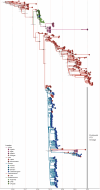
Fig 1
Fig 1. Time-resolved phylogeny from the discrete phylogeographic analysis of Florida Clade 1.
MCC tree obtained from the analysis of the HA-only dataset. Branches are coloured according to the most probable location of the parental node of each lineage (colour codes are shown in the lower left) across the five defined global regions. Tips representing European sequences are coloured based on their country of origin. Diamonds on nodes represent posterior probability support ≥ 0.9, with grey horizontal bars representing the 95% HPD estimates for node age.
Fig 2
Fig 2. Time-resolved phylogeny of EIV viruses from the UK.
The tips in the maximum clade credibility tree are coloured according to the viral clusters, while singletons and low-support clusters are shown in grey. Nodes with posterior probability ≥ 0.9 are labelled with a diamond.
Fig 3
Fig 3. Phylodynamics of viruses isolates during the FC1 EI epizootic in the United Kingdom.
(A) Time-resolved phylogeny of UK viruses with the summary of the phylogeographic ancestral state reconstruction. Colours on tips and branches correspond to the regions outlined in the upper-right inset. Nodes with posterior probability ≥ 0.9 are labelled with diamonds. (B) Supported lineage dispersal events between locations. The thickness of the arrows indicates the corresponding standard BF; only transitions with strong support BF ≥ 20 are plotted. Base UK map shapefile sourced from Natural Earth (https://www.naturalearthdata.com/) public domain. (C) Contribution of each region in seeding viral lineages to (any) other locations through time measured as the mean count of Markov jumps per day across all trees in the posterior distribution and smoothed using a 7-day centred rolling mean. (D) Between-region circular migration flow plot as estimated from the Markov jumps analysis. Arrows indicate the direction of the migration and thickness is relative to the number of jumps. Only migration events associated with a BF support ≥3 are reported.
Fig 4
Fig 4. Comparison of EIV HA and NA protein sequences.
(A) Amino acid changes on surface glycoproteins between A/equine/Lincolnshire/00620/2019 (UK/2019) and the vaccine strains commonly used: A/equine/South Africa/4/2003 (SA/2003) and A/equine/Richmond/1/2007 (UK/2007), and a more recent FC2 strain A/equine/Kent/2015 (UK/2015). (B) Viral shedding in vaccinated and unvaccinated horses affected during the 2019 epizootic in the UK. Viral load (determined by qPCR) in vaccinated (n = 74) and unvaccinated horses (n = 297) stratified by day since the onset of clinical signs.
Fig 5
Fig 5. Phylodynamics of the H3N8 EIV lineage between 1963 and 2022.
(A) Supported lineage dispersal events between locations. The thickness of the arrows indicates the corresponding standard BF; only transitions with positive support BF ≥ 3 are plotted. Base map shapefile sourced from Natural Earth (https://www.naturalearthdata.com/) public domain. (B) Between-region circular migration flow plot as estimated from the Markov jumps analysis. Arrows indicate the direction of the migration and thickness is relative to the number of jumps. Only migration events associated with a BF support ≥3 are reported. (C) Markov reward times per region. The boxplot of each region depicts the density distribution of the total time (boxes show the median and HPD80 interval).

Similar articles

References

    1. Grenfell BT, Pybus OG, Gog JR, Wood JLN, Daly JM, Mumford JA, et al. Unifying the epidemiological and evolutionary dynamics of pathogens. Science. 2004;303(5656):327–32. doi: 10.1126/science.1090727 - DOI - PubMed
    1. Volz EM, Koelle K, Bedford T. Viral phylodynamics. PLoS Comput Biol. 2013;9(3):e1002947. doi: 10.1371/journal.pcbi.1002947 - DOI - PMC - PubMed
    1. Lemey P, Rambaut A, Bedford T, Faria N, Bielejec F, Baele G, et al. Unifying viral genetics and human transportation data to predict the global transmission dynamics of human influenza H3N2. PLoS Pathog. 2014;10(2):e1003932. doi: 10.1371/journal.ppat.1003932 - DOI - PMC - PubMed
    1. Lemey P, Hong SL, Hill V, Baele G, Poletto C, Colizza V, et al. Accommodating individual travel history and unsampled diversity in Bayesian phylogeographic inference of SARS-CoV-2. Nat Commun. 2020;11(1):5110. doi: 10.1038/s41467-020-18877-9 - DOI - PMC - PubMed
    1. Lu L, Zhang F, Oude Munnink BB, Munger E, Sikkema RS, Pappa S, et al. West Nile virus spread in Europe: Phylogeographic pattern analysis and key drivers. PLoS Pathog. 2024;20(1):e1011880. doi: 10.1371/journal.ppat.1011880 - DOI - PMC - PubMed

MeSH terms

LinkOut - more resources