. 2025 Jun 9;21(6):e1013147.
doi: 10.1371/journal.pcbi.1013147. eCollection 2025 Jun.

A linear perception-action mapping accounts for response range-dependent biases in heading estimation from optic flow

Affiliations

A linear perception-action mapping accounts for response range-dependent biases in heading estimation from optic flow

Qi Sun et al. PLoS Comput Biol. .

Abstract

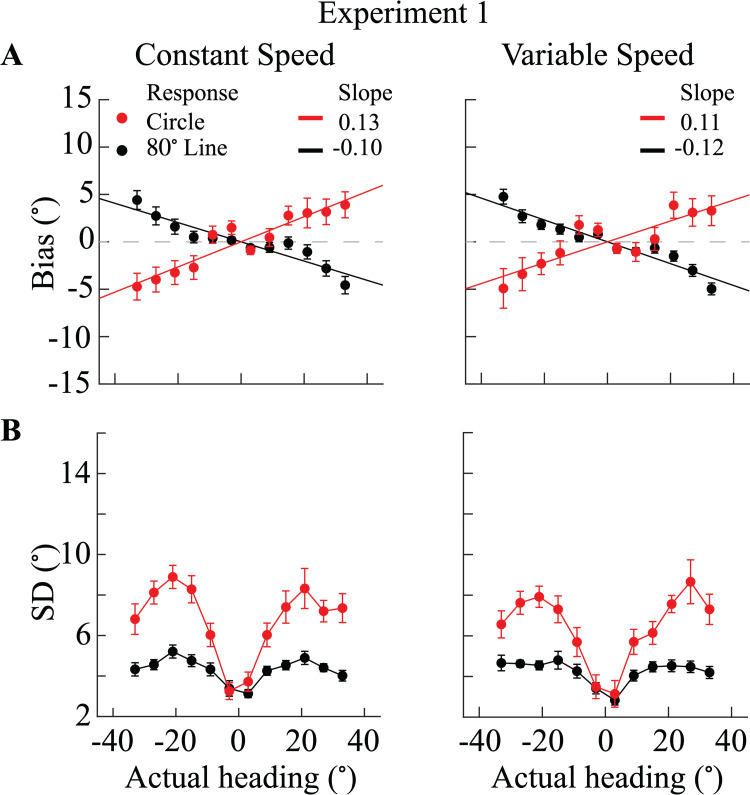
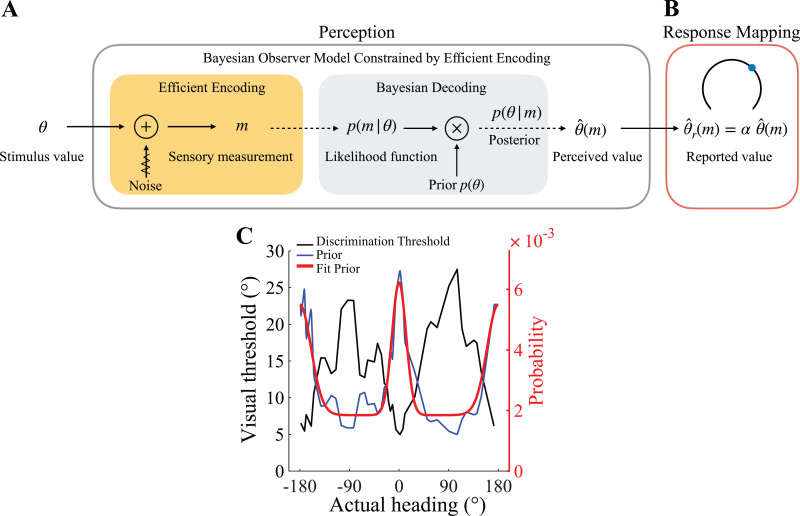
Accurate estimation of heading direction from optic flow is a crucial aspect of human spatial perception. Previous psychophysical studies have shown that humans are typically biased in their heading estimates, but the reported results are inconsistent. While some studies found that humans generally underestimate heading direction (center bias), others observed the opposite, an overestimation of heading direction (peripheral bias). We conducted three psychophysical experiments showing that these conflicting findings may not reflect inherent differences in heading perception but can be attributed to the different sizes of the response range that participants were allowed to utilize when reporting their estimates. Notably, we show that participants' heading estimates monotonically scale with the size of the response range, leading to underestimation for small and overestimation for large response ranges. Additionally, neither the speed profile of the optic flow pattern nor the response method (mouse vs. keyboard) significantly affected participants' estimates. Furthermore, we introduce a Bayesian heading estimation model that can quantitatively account for participants' heading reports. The model assumes efficient sensory encoding of heading direction according to a prior inferred from human heading discrimination data. In addition, the model assumes a response mapping that linearly scales the perceptual estimate with a scaling factor that monotonically depends on the size of the response range. This simple perception-action model accurately predicts participants' estimates both in terms of mean and variance across all experimental conditions. Our findings underscore that human heading perception follows efficient Bayesian inference; differences in participants reported estimates can be parsimoniously explained as differences in mapping percept to probe response.


Conflict of interest statement

The authors have declared that no competing interests exist.

Figures

Fig 1
Fig 1. Heading estimation based on optic flow.
(A) Illustration of an optic flow pattern [17] that simulates an observer moving straight-forward (i.e., a heading direction of 0°). The dots indicate the positions of dots in the first frame. The white lines (invisible in the experiment) indicate the motion trajectory of dots in the subsequent frames. Previous heading perception studies have used very similar optic flow stimuli. (B) Response methods used in our three experiments. In Experiment 1, participants either used a mouse-controlled probe on a horizontal line with a range of 80° (left panel) or moved a key-controlled dot on a circle with a range of 360° (middle panel) to indicate their perceived heading direction. In Experiment 2, all participants reported their perceived heading direction by moving a mouse-controlled probe on a line (block 1), circle (block 2), or an arc with a range of 80° (block 3, right panel). In Experiment 3, participants reported their estimates for three different arc ranges: 80°, 160°, or 240° (right panel). The range of tested heading directions in all experiments was [-33°, +33°]. Note, the white lines and the numbers denoting the range were not shown to participants during the experiment.
Fig 2
Fig 2. Bias and standard deviation in perceived heading direction (Experiment 1, N = 18)
(A) Average bias across participants as function of actual heading angle (0° corresponds to straight-ahead). To capture the general tendency towards over- or underestimation, we applied a linear fit to the measured bias data points (solid lines). Positive slope values indicate overestimation (peripheral bias), while a negative slope indicates underestimation (center bias). (B) Average standard deviation (SD) of reported heading estimates across participants as a function of actual heading direction. Red dots correspond to estimates reported on the circle, and black dots correspond to estimates reported on the line. Error bars in all panels indicate the standard error across participants.
Fig 3
Fig 3. Bias and standard deviation in perceived heading direction (Experiments 2 and 3, N = 18)
(A, B) Average bias of participants as a function of heading direction (0° corresponds to straight-ahead). Solid lines represent linear fits to the average bias curves. A positive slope indicates overestimation (peripheral bias), while a negative slope indicates underestimation (center bias). (C, D) Average standard deviation of reported heading estimates as a function of heading direction. In (A, C), the red, blue and black dots represent the circle, 80° arc, and line response conditions, respectively. In (B, D), the red, blue and black dots represent the 240°, 160°, and 80° arc response conditions, respectively. In all panels, error bars indicate the standard errors across participants.
Fig 4
Fig 4. Extended efficient Bayesian observer model.
(A) The efficient Bayesian observer model [19] assumes that the stimulus feature θ (e.g., heading direction) is first efficiently encoded in a sensory signal m before a Bayesian inference process computes an optimal estimate of the feature value θ^(m). (B) We extended the efficient Bayesian observer model by assuming a response mapping that maps the perceptual estimate θ^(m) to the participants reports θ^r(m) in the experiment. We assume that this mapping is linear, thus θ^r(m)=αiθ^(m) where αi is positive and monotonically depends on the size of the response range. (C) Prior distribution for heading direction, p(θ). We estimate a single prior for all participants based on previously measured heading discrimination thresholds D(θ) [8]. Under the efficient coding assumption, the prior is inversely proportional to D(θ) [,–30]. We smoothly approximate the experimentally determined prior with a two-peak von-Mises distribution, providing an indirect estimate of the underlying natural distribution of heading directions. S3 Fig shows an alternative method of obtaining a similar estimate of the heading prior based on neural response characteristics.
Fig 5
Fig 5. Fit of the extended efficient Bayesian observer model to the data from Experiment 3.
(A) Values of the scaling factor α from the group-level fit (left panel; combined data from all participants) and individual-level fits (right panel; fits to each participant's data). The right panel also shows the mean α values across participants for each response range condition. A repeated-measures ANOVA with Bonferroni-corrected post-hoc tests revealed that α significantly increases with the response range (***p < 0.001). (B) Fit values of the sensory noise parameter κ (group-level and individual-level fits). (C, E) Model predictions for bias and standard deviation of heading estimates, respectively, based on the group-level (left panel) and individual-level (right panel) fits. Shaded areas represent the standard error across the 18 participants. (D, F) Mean bias and standard deviation of heading estimates across the 18 participants in Experiment 3. Error bars indicate the standard error of the mean across participants.
Fig 6
Fig 6. Behavioral data and model fits for individual participants in Experiment 3, demonstrating the model's ability to capture individual-level patterns in heading estimation biases and variability.

References

    1. Appelle S. Perception and discrimination as a function of stimulus orientation: the “oblique effect” in man and animals. Psychol Bull. 1972;78(4):266–78. doi: 10.1037/h0033117 - DOI - PubMed
    1. Olkkonen M, McCarthy PF, Allred SR. The central tendency bias in color perception: effects of internal and external noise. J Vis. 2014;14(11):5. doi: 10.1167/14.11.5 - DOI - PubMed
    1. de Gardelle V, Kouider S, Sackur J. An oblique illusion modulated by visibility: non-monotonic sensory integration in orientation processing. J Vis. 2010;10(10):6. doi: 10.1167/10.10.6 - DOI - PubMed
    1. Taylor R, Bays PM. Efficient Coding in Visual Working Memory Accounts for Stimulus-Specific Variations in Recall. J Neurosci. 2018;38(32):7132–42. doi: 10.1523/JNEUROSCI.1018-18.2018 - DOI - PMC - PubMed
    1. Noel J-P, Zhang L-Q, Stocker AA, Angelaki DE. Individuals with autism spectrum disorder have altered visual encoding capacity. PLoS Biol. 2021;19(5):e3001215. doi: 10.1371/journal.pbio.3001215 - DOI - PMC - PubMed

LinkOut - more resources