. 2025 Jun 9;9(7):e0715.
doi: 10.1097/HC9.0000000000000715. eCollection 2025 Jul 1.

NME2 modulates HCC progression through 4EBP1 phosphorylation and autophagy regulation independent of mTOR

Affiliations

NME2 modulates HCC progression through 4EBP1 phosphorylation and autophagy regulation independent of mTOR

Wei Chen et al. Hepatol Commun. .

Abstract

Background: To investigate the role of nucleoside diphosphate kinase 2 (NME2) in HCC progression, assessing its therapeutic potential.

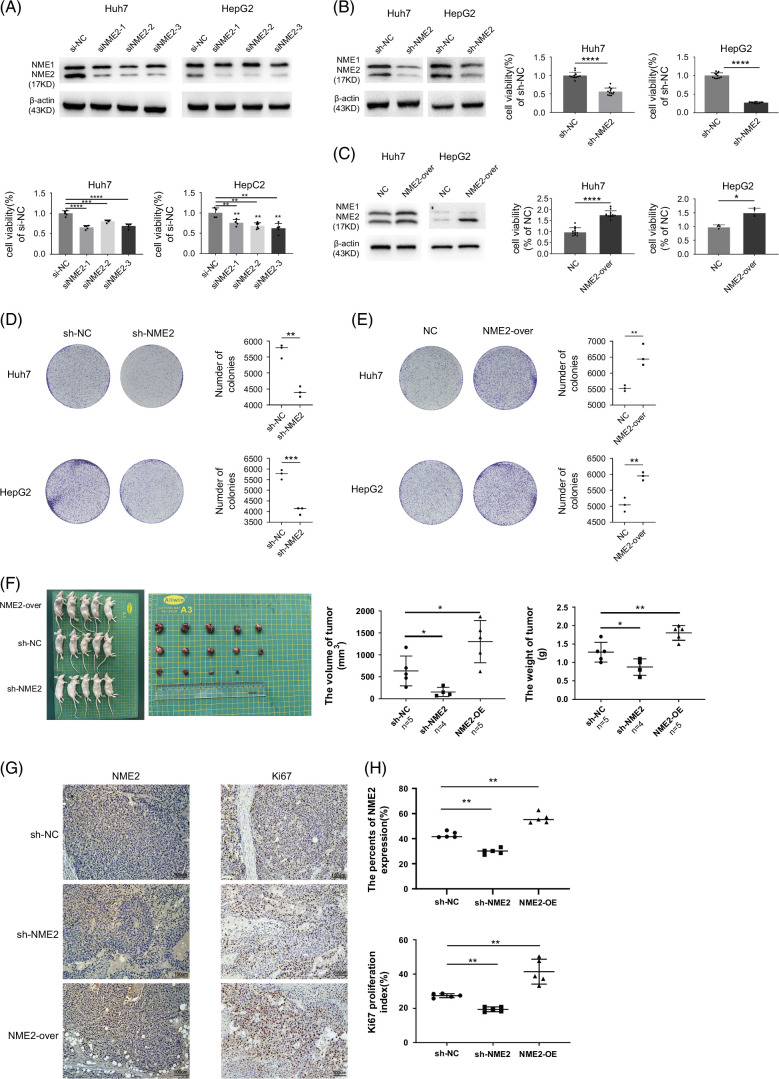
Methods: Utilizing transcriptome sequencing data from The Cancer Genome Atlas (TCGA) and immunohistochemical staining of tissue microarrays, we analyzed NME2 expression in HCC tumor tissues. The effects of NME2 on HCC cell proliferation and autophagy flux were assessed through knockdown and overexpression experiments. Additionally, the relationship between NME2 and 4EBP1 phosphorylation was explored through specific site mutation analysis.

Results: NME2 overexpression in HCC correlated with poor prognosis. NME2 knockdown significantly hindered HCC cell proliferation and induced autophagy flux. Notably, NME2 modulates 4EBP1 phosphorylation (Thr37/46) independently of mTOR, unveiling a novel axis in HCC pathogenesis. Additionally, NME2 modulates eukaryotic translation initiation factor 4F (eIF4F) complex formation and autophagy flux.

Conclusions: NME2 plays a crucial role in HCC development by modulating 4EBP1 phosphorylation and autophagy through an mTOR-independent pathway. Our research underscores NME2's significance as a potential therapeutic target in HCC, meriting further exploration of its underlying mechanisms and clinical applicability.

Keywords: HCC; autophagy flux; cell proliferation; eIF4F complex formation; mTOR-independent mechanism.


Conflict of interest statement

The authors have no conflicts to report.

Figures

FIGURE 1
FIGURE 1
NME2 overexpression in HCC tumor tissues correlates with poor prognosis. (A) Boxplot showing the expression of NME2 in TCGA-LIHC, GSE76427, GSE104310, GSE105130, and GSE14520. (B) Analysis of transcriptome sequencing data from the TCGA-LIHC revealed NME2 expression and its association with different clinical features. (C) Immunohistochemistry was employed to assess the expression of NME2 in 96 HCC patients (The Pearson test was used to compare the 2 groups). (D) Kaplan–Meier survival analysis demonstrated a correlation between NME2 expression and overall survival in patients (p=0.015, HR=1.102). (E) Multivariate Cox regression analysis was conducted to identify independent risk factors for overall survival in HCC patients. (F) Nomogram analysis was applied to evaluate the impact of various factors on the 3-year and 5-year survival rates in patients with HCC tumors. Data represented the mean ± SD of at least 3 independent experiments. t Tests were utilized unless otherwise specified; *p<0.05, **p<0.01, ***p<0.001, and ****p<0.0001. Abbreviations: NME2, nucleoside diphosphate kinase 2; TCGA, The Cancer Genome Atlas.
FIGURE 2
FIGURE 2
NME2 knockdown diminishes proliferation in HCC cells both in vitro and in vivo. (A) MTT assay evaluated the impact of the cell proliferation of Huh7 and HepG2 HCC cell lines after NME2 knockdown with si-NME2. (B, C) MTT assay showed the proliferation of Huh7 and HepG2 HCC cell lines after NME2 knockdown and overexpression with lentiviruses. (D, E) Colony formation assay revealed decreased clonogenic potential after NME2 knockdown in Huh7 and HepG2 cell lines. ImageJ was used to process the images. (F) In vivo studies indicated that NME2 knockdown reduced tumor growth in nude mice (one nude mouse in the shNME2 group showed no tumor formation). (G, H) NME2 and Ki67 expression levels were analyzed through immunohistochemical staining in tumor tissues of nude mice. ImageJ was used to process the images. Scale bar=5 um. Data represented the mean ± SD of at least 3 independent experiments. An unpaired Student t test was used to compare differences between the 2 groups. One-way ANOVA was used to analyze the differences among multiple groups, followed by Tukey posttest; *p<0.05, **p<0.01, ***p<0.001, and ****p<0.0001. Abbreviation: NME2, nucleoside diphosphate kinase 2.
FIGURE 3
FIGURE 3
NME2 knockdown induces autophagic flux in HCC cells. (A) GSEA analysis showed that the transcription level of NME2 was associated with the regulation of autophagy. (B) GSVA analysis of autophagy-related pathways between the high-expression NME2 groups. (C, D) Autophagy-related protein alterations (LC3B, Beclin-1, P62, ATG5) were detected in Huh7 cells with NME2 knockdown. (E) Transmission electron microscopy uncovers a rise in autophagosomes in NME2 knockdown Huh7 cells (autophagosomes are marked by red arrows). Scale bar=1 μm. Magnification: 20,000× (F). Western blot analysis confirmed changes in LC3B expression in NME2 knockdown cells after 24 hours of treatment with chloroquine (CQ). (G) NME2 knocking down Huh7 cells are transfected with the mCherry-eGFP-LC3B plasmid and display more autophagosomes and autolysosomes. ImageJ was used to process the images. Scale bar=20 μm. (H) Immunohistochemistry validated the expression level of LC3B in xenograft nude mice models with NME2 knockdown and NME2 overexpression. Scale bar=50 μm. ImageJ was used to process the images. The concentration of CQ was 10 μM. Data represented the mean ± SD of at least 3 independent experiments. Unpaired Student t test was used to compare differences between 2 groups. One-way ANOVA was used to analyze the differences among multiple groups, followed by Tukey posttest; *p<0.05, **p<0.01, ***p<0.001, and ****p<0.0001. Abbreviations: CQ, chloroquine; NME2, nucleoside diphosphate kinase.
FIGURE 4
FIGURE 4
NME2 regulates 4EBP1 (Thr37/46) phosphorylation independent of the mTOR pathway. (A) The PI3K/AKT/mTOR/p70S6K signaling protein levels were validated after NME2 knockdown and overexpression in Huh7 cells by Western blot. (B, C) NME2 modulation impacts 4EBP1 phosphorylation, as shown via Western blot. (D) 4EBP1 phosphorylation persisted under NME2 overexpression even when mTOR was inhibited by RARP. (D) Immunoprecipitation confirms the binding interaction between NME2 and 4EBP1 in Huh7 cells. (E) Immunofluorescence co-localization demonstrates the regulatory association and binding between NME2 and 4EBP1, as well as its phosphorylated form (Thr37/46) in Huh7 cells with NME2 knockdown. Scale bar=10 μm. (F) Immunofluorescence co-localization demonstrates the regulatory association and binding between NME2 and 4EBP1, as well as its phosphorylated form (Thr37/46) in tumor tissues of nude mice (sh-NC vs. sh-NME2). Scale bar=20 μm. (G) 4EBP1 phosphorylation persisted under NME2 overexpression even when mTOR was inhibited by RARP and MK-206. (H) MTT assay showed the effect of RAPA combined with NME2 knockdown on the proliferation of Huh7 cells. (I) The effect of NME2 overexpression on autophagy in Huh7 cells was demonstrated by mCherry-eGFP-LC3B plasmid transfection. The concentration of RARP and MK-206 was 10 μM. Data represented the mean ± SD of at least 3 independent experiments. Unpaired Student t test was used to compare differences between 2 groups. One-way ANOVA was used to analyze the differences among multiple groups, followed by a Tukey posttest. *p<0.05, **p<0.01, ***p<0.001, and ****p<0.0001. Abbreviations: NME2, nucleoside diphosphate kinase; RARP, rapamycin.
FIGURE 5
FIGURE 5
NME2 inhibits autophagy flux in HCC cells by regulating eIF4F complex formation. (A) 4EBP1 overexpression and 4EBP1 (T37/46) mutant Huh7 cell lines were generated in vitro, and Western blot analysis was employed to assess the impact of 4EBP1 (T37/46) mutation on NME2 in HCC cells. (B) Western blot analysis illustrated NME2 knockdown’s impact on LC3B levels in cells with the 4EBP1 (Thr37/46) mutation. (C) Electron microscopy showed autophagosomes in cells with 4EBP1-over and 4EBP1 (Thr37/46) mutated Huh7 cells following NME2 knockout (autophagosomes are marked by red arrows). Scale bar=1μm. Magnification: 20,000×. (D) MTT assay evaluated the impact of NME2 knockdown on cell proliferation in Huh7 cells with 4EBP1 (Thr37/46) mutation. (E) The impact of 4EGI-1 on the proliferation of NME2-overexpressing Huh7 cells was assessed using an MTT assay. (F) Western blot analysis verified the influence of 4EGI-1 on LC3B levels in NME2-overexpressing Huh7 cells. (G, H) Electron microscopy was utilized to assess the effect of 4EGI-1 on the number of autophagosomes in NME2-overexpressing Huh7 cells (autophagosomes are marked by red arrows). Scale bar=1 μm. Magnification: 20,000×. The concentration of 4EGI-1 was 10 μM. Data represented the mean ± SD of at least 3 independent experiments. Unpaired Student t test was used to compare differences between 2 groups. One-way ANOVA was used to analyze the differences among multiple groups, followed by Tukey posttest; *p<0.05, **p<0.01, ***p<0.001, and ****p<0.0001.

References

    1. Tapper EB, Wong CC-L. The future of Hepatology Communications. Hepatol Commun. 2023;7:e0085. - PMC - PubMed
    1. Singal AG, Kudo M, Bruix J. Breakthroughs in hepatocellular carcinoma therapies. Clin Gastroenterol Hepatol. 2023;21:2135–2149. - PMC - PubMed
    1. Li S, Hu Z, Zhao Y, Huang S, He X. Transcriptome-wide analysis reveals the landscape of aberrant alternative splicing events in liver cancer. Hepatology. 2019;69:359–375. - PubMed
    1. Craig AJ, von Felden J, Garcia-Lezana T, Sarcognato S, Villanueva A. Tumour evolution in hepatocellular carcinoma. Nat Rev Gastroenterol Hepatol. 2020;17:139–152. - PubMed
    1. Levrero M, Zucman-Rossi J. Mechanisms of HBV-induced hepatocellular carcinoma. J Hepatol. 2016;64(1 suppl):S84–S101. - PubMed

MeSH terms

Substances