. 2025 Aug:98:102182.
doi: 10.1016/j.molmet.2025.102182. Epub 2025 Jun 7.

microRNA-1 regulates metabolic flexibility by programming adult skeletal muscle pyruvate metabolism

Affiliations

microRNA-1 regulates metabolic flexibility by programming adult skeletal muscle pyruvate metabolism

Ahmed Ismaeel et al. Mol Metab. 2025 Aug.

Erratum in

Abstract

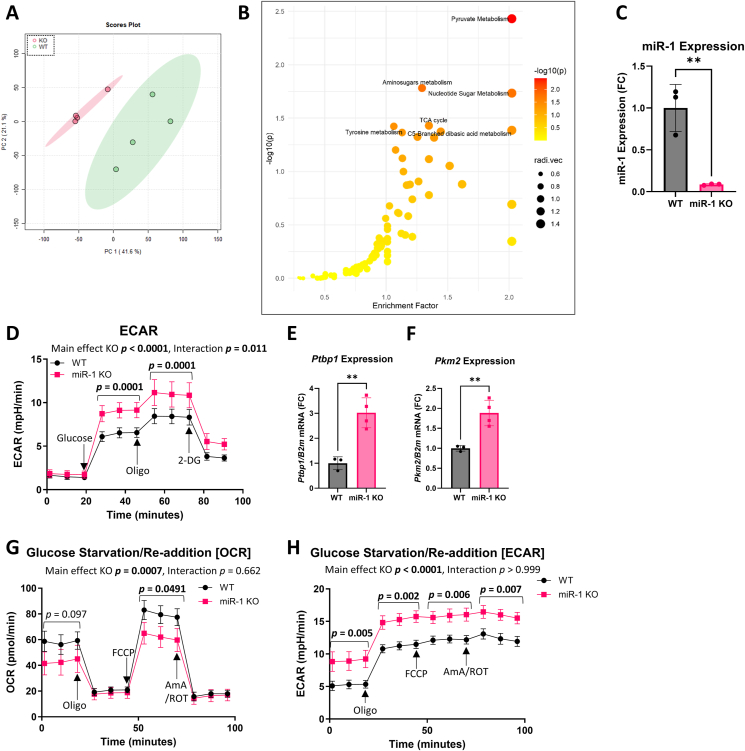
Objective: Metabolic flexibility refers to the ability of tissues to adjust cellular fuel choice in response to conditional changes in metabolic demand and activity. A loss of metabolic flexibility is a defining feature of various diseases and cellular dysfunction. This study investigated the role of microRNA-1 (miR-1), the most abundant microRNA in skeletal muscle, in maintaining whole-body metabolic flexibility.

Methods: We used an inducible, skeletal muscle-specific knockout (KO) mouse model to examine miR-1 function. Argonaute 2 enhanced crosslinking and immunoprecipitation sequencing (AGO2 eCLIP-seq) and RNA-seq analyses identified miR-1 target genes. Metabolism was investigated using metabolomics, proteomics, and comprehensive bioenergetic and activity phenotyping. Corroborating information was provided from cell culture, C. elegans, and exercised human muscle tissue.

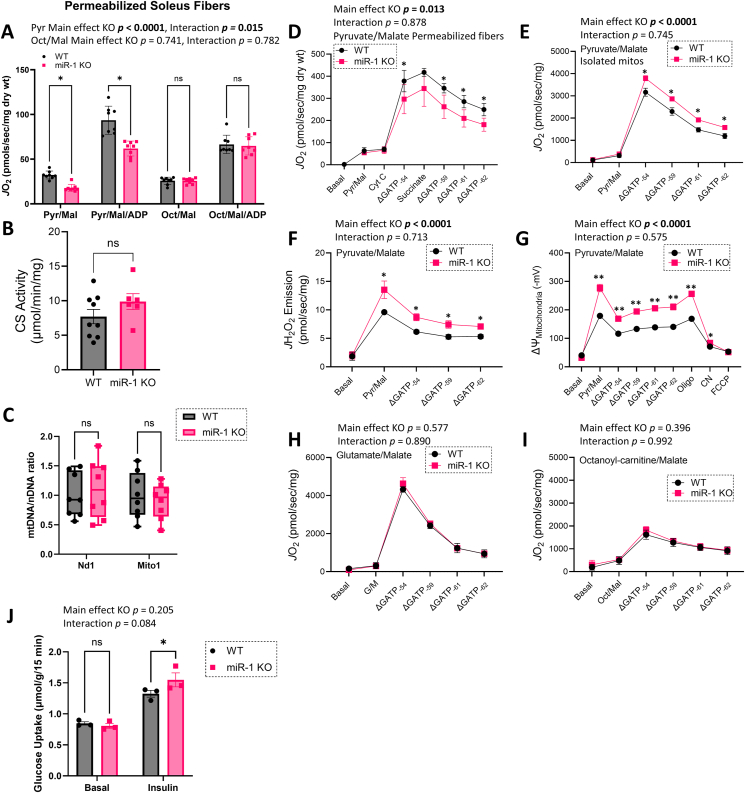
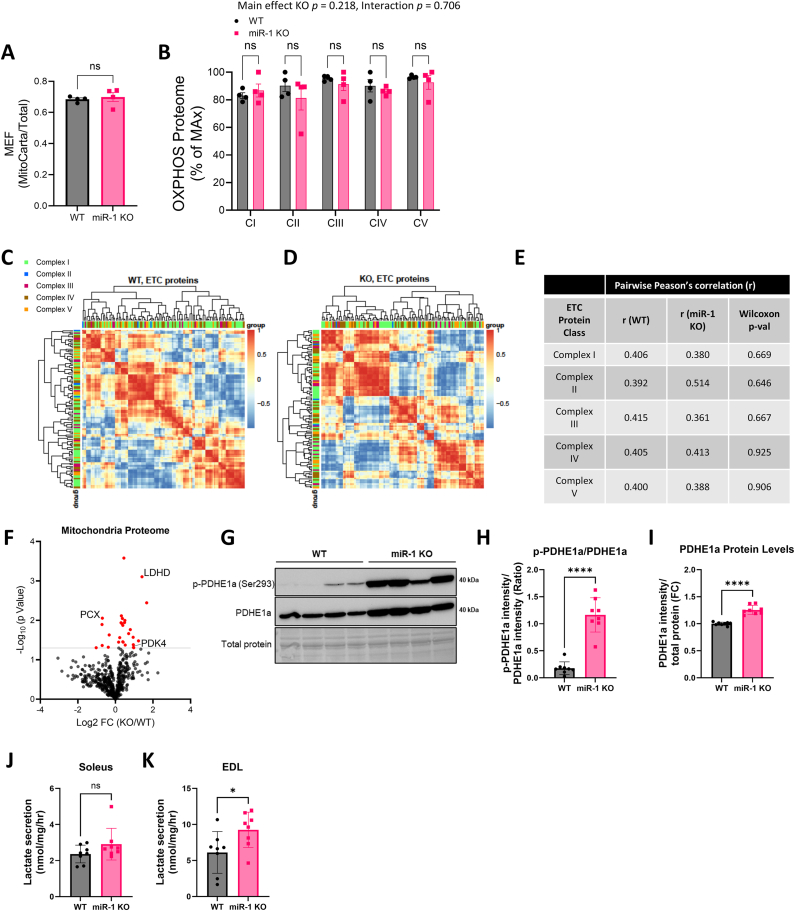
Results: miR-1 KO mice demonstrated loss of diurnal oscillations in whole-body respiratory exchange ratio and higher fasting blood glucose. For the first time, we identified bona fide miR-1 target genes in adult skeletal muscle that regulated pyruvate metabolism through mechanisms including the alternative splicing of pyruvate kinase (Pkm). The maintenance of metabolic flexibility by miR-1 was necessary for sustained endurance activity in mice and in C. elegans. Loss of metabolic flexibility in the miR-1 KO mouse was rescued by pharmacological inhibition of the miR-1 target, monocarboxylate transporter 4 (MCT4), which redirects glycolytic carbon flux toward oxidation. The physiological down-regulation of miR-1 in response to hypertrophic stimuli caused a similar metabolic reprogramming necessary for muscle cell growth.

Conclusions: These data identify a novel post-transcriptional mechanism of whole-body metabolism regulation mediated by a tissue-specific miRNA.

Keywords: Aerobic glycolysis; MCT4; PKM; Resistance training; VB124; eCLIP-seq.


Conflict of interest statement

Declaration of competing interest The authors declare that they have no known competing financial interests or personal relationships that could have appeared to influence the work reported in this paper.

Figures

Image 1
Graphical abstract
Figure 1
Figure 1
Effect of miR-1 loss on metabolic flexibility and exercise performance. (A) Respiratory exchange ratio (RER) via indirect calorimetry over a 48-hr period. (B) Box plots (min-to-max) showing median and interquartile range (IQR) for RER data. (C) Whole-body oxygen consumption (VO2) and (D) locomotor activity during indirect calorimetry period. Data in A-D are mean ± SEM, plotted using CalR (Ver. 2), and analyzed using a two-way ANOVA for light and dark cycles separately. (E) Fasting basal blood glucose levels, data analyzed using independent t-tests (2-tailed). (F) Glucose tolerance test (GTT), data are mean ± SD, data analyzed by two-way ANOVA, main effect of miR-1 knockout (KO) and interaction (genotype x time) shown. Data in A-F from n = 5 female wild-type (WT) mice and n = 5 female miR-1 KO mice. (GH) ClockLab analyses of 4 weeks of voluntary wheel running. Average (G) daily running volume (km/day) and (H) maximum running bout (sec). Data in G-H from n = 5 female mice per group. (IJ) CeLeST analysis of (I) wave initiation rate and (J) activity index in Untrained N2 (WT) (n = 32) and mir-1 mutant worms (n = 35). (KL) CeLeST analysis of (K) wave initiation rate and (L) activity index in Untrained (dark circle) or Exercised (open circle) N2 (n = 32 and n = 36, respectively), and Untrained (dark square) and Exercised (open square) mir-1 mutant worms (n = 35 and n = 36, respectively). Data in I-J analyzed using independent t-tests (2-tailed). Data in K-L analyzed using a two-way ANOVA, main effect of miR-1 KO, interaction (genotype x exercise), and results of post-hoc Tukey's multiple comparisons tests shown. ∗p < 0.05, ∗∗p < 0.01, ∗∗∗∗p < 0.0001, ns: not significant.
Figure 2
Figure 2
Transcriptomic profiling of miR-1 KO skeletal muscle and identification of bona fide miR-1 target genes. (A) Cumulative density function (CDF) of AGO2 eCLIP-seq-defined miR-1 targets (green) Log2FC compared to non-miR-1 targets (blue). Zoomed in figure emphasizes rightward shift of miR-1 targets, indicated by arrow. RNA-seq data for integration with AGO2 eCLIP-seq are from gastrocnemius muscles (n = 4 female WT, n = 4 female miR-1 KO mice). (B) Pathway enrichment analysis of significantly up-regulated genes (false discovery rate, FDR <0.05, Log2 fold change, FC > 0) in miR-1 KO/WT that are AGO2 eCLIP-seq-defined miR-1 target genes. (CD) miR-1 binding peaks in (C) polypyrimidine tract-binding protein 1 (PTBP1) and (D) pyruvate kinase M1/2 (PKM) mRNA outlined with red dotted line, miR-1 alignment on mouse target sequence shown below. (E) Representative Western blot of PTBP1 and corresponding total protein levels in WT and miR-1 KO. (F) Quantification of PTBP1 protein levels after densitometric analysis of the levels of each sample normalized to corresponding total protein levels, expressed as fold-change (FC). (G) Representative Western blot of PKM1 and PKM2, (H–I) Quantification of (H) PKM1 and (I) PKM2 protein levels. (JK) miR-1 binding peaks in (J) lactate dehydrogenase A (LDHA) and (K) solute carrier family 16 member 3 (SLC16A3) mRNA. (L) Western blot of LDH, (M) quantification of LDH protein levels. (N) Western blot of monocarboxylate transporter 4 (MCT4), (O) quantification of MCT4 protein levels. For Western blotting experiments, gastrocnemius muscle lysates from n = 4–8 WT and n = 4–8 miR-1 KO females were used, and differences between WT and miR-1 KO were tested using an independent t-test (2-tailed). ∗p < 0.05, ∗∗∗p < 0.01, ∗∗∗∗p < 0.0001, ns: not significant.
Figure 3
Figure 3
Skeletal muscle metabolomic profiling of miR-1 KO skeletal muscle. (A) Principal component analysis (PCA) scores plot generated using MetaboAnalyst based on gastrocnemius metabolites in n = 4 WT and n = 4 miR-1 KO female mice. Predictive component (PC) 1 and PC2 can differentiate the WT and miR-1 KO muscle. (B) Summary of altered metabolic pathways analysis with MetaboAnalyst reflecting the impact on the pathway and the level of significance. The colors of dots (varying from yellow to red) indicate the significance of the metabolites in the data, and the size of the dot is positively corelated with the impact of the metabolic pathway. Top 6 pathways labeled. (C) miR-1 expression of 4-Hydroxytamoxifen (4-OH TAM)-treated myotubes from WT or miR-1 KO mice (n = 3 untreated female mice per group). (D) Extracellular acidification rate (ECAR) trace over time after injection of indicated glycolytic modulators in WT (n = 3 female) and miR-1 KO (n = 4 female)-derived myotubes. Oligo: oligomycin, 2-DG: 2-deoxy-d-glucose. (E)Ptbp1 and (F)Pkm2 mRNA expression of WT and miR-1 KO myotubes. (G) Oxygen consumption rate (OCR) trace over time after injection of mitochondrial respiration modulators in WT (n = 3 female) and miR-1 KO (n = 4 female)-derived myotubes that were exposed to glucose starvation followed by re-addition. FCCP: carbonyl cyanide-p-trifluoromethoxyphenylhydrazone, AmA/ROT: antimycin A/rotenone. Data in C, E-F analyzed using independent t-tests (2-tailed). Data in D, G-H analyzed by two-way ANOVA, main effect of miR-1 KO, interaction (genotype x substrates), and results of post-hoc Tukey's multiple comparisons tests shown. ∗p < 0.05, ∗∗p < 0.01.
Figure 4
Figure 4
Bioenergetic phenotyping of miR-1 KO skeletal muscle. (A) Assessment of mitochondrial respiration in permeabilized soleus fibers (n = 8 female WT or miR-1 KO mice per group). Oxygen flux (JO2) normalized to mg tissue dry weight. Pyruvate/Malate-supported complex I leak (Pyr/Mal) and ADP-stimulated OXPHOS (Pyr/Mal/ADP), Octanoyl-carnitine/Malate-supported complex I leak (Oct/Mal) and ADP-stimulated OXPHOS (Oct/Mal/ADP). (B) Citrate synthase (CS) activity in gastrocnemius complex lysates, normalized to protein. (C) Quantification of mitochondrial DNA (mtDNA) by levels of NADH Dehydrogenase 1 (Nd1), and Mito1 relative to nuclear DNA (nDNA) in gastrocnemius muscle. Data in B–C from n = 6–9 female mice per group. (D) Assessment of OXPHOS kinetics using the creatine kinase (CK) clamp technique (increasing free energies [i.e., more negative ΔGATP values correspond to an increased ATP/ADP ratio)] with Pyr/Mal and succinate as substrates in permeabilized fibers from the gastrocnemius, data normalized to mg dry weight. (E) Assessment of OXPHOS kinetics using the CK clamp technique with Pyr/Mal as substrates in isolated mitochondria, data normalized to total protein. (F) H2O2 emission rate (JH2O2) assessed in isolated mitochondria in response to Pyr/Mal using a CK clamp, normalized to total protein. (G) Mitochondrial membrane potential (ΔΨ), expressed in mV, in response to Pyr/Mal using a CK clamp. Oligo: oligomycin, CN: cyanide. (H) OXPHOS kinetics using the CK clamp technique with glutamate/malate (G/M) as substrates in isolated mitochondria, data normalized to total protein. (I) OXPHOS kinetics using the CK clamp technique with octanoyl-carnitine/malate (Oct/Mal) as substrates in isolated mitochondria, data normalized to total protein. (J) [3H]-2-Deoxyglucose uptake in EDL muscles with or without 200 μU/mL of insulin. Data in D-J from n = 3–4 WT and n = 3–4 miR-1 KO female mice, and data are mean ± SEM. Data in A, D-I analyzed by two-way ANOVA, main effect of miR-1 KO, interaction (genotype x ADP for A, genotype x ΔGATP for D-I), and results of post-hoc Tukey's multiple comparisons tests shown. Data in B–C analyzed by t-tests (2-tailed). Data in J analyzed by a two-way ANOVA, main effect of miR-1 KO and interaction effect (genotype x insulin), and results of post-hoc Tukey's multiple comparisons tests shown. ns: not significant, ∗p < 0.05, ∗∗p < 0.01.
Figure 5
Figure 5
Mitochondrial-enriched proteomics of miR-1 KO skeletal muscle. (A) Ratio of mitochondrial protein to total protein abundance across samples, referred to as Mitochondrial Enrichment Factor (MEF). (B) Quantification of the OXPHOS protein complexes generated by the summed abundance of all subunits within a given complex. Data are presented as a percentage of the max for each complex. (CD) Hierarchically clustered heatmap of Pearson's correlation matrix for electron transport chain (ETC) proteins in (C) WT and (D) miR-1 KO mitochondria. (E) Pearson's correlation measurements comparing WT and miR-1 KO for each ETC complex. (F) Volcano plot depicting changes in the skeletal muscle mitochondrial proteome. Red color indicates significance (p < 0.05), and differentially expressed proteins involved in pyruvate metabolism are labeled. Data in A-C from n = 4 WT and n = 4 miR-1 KO female mice. (G) Representative Western blot of phosphorylation of Ser 293 on the PDHE1a subunit [p-PDHE1a(Ser293)], total PDHE1a, and corresponding total protein levels in WT and miR-1 KO gastrocnemius muscle lysates. (H) Quantification of p-PDHE1a/total PDHE1a protein levels after densitometric analysis of the levels of each sample (n = 8 WT and n = 8 miR-1 KO) normalized to corresponding total protein levels, expressed as a ratio. (I) Quantification of total PDHE1a protein levels after densitometric analysis of the levels of each sample normalized to corresponding total protein levels, expressed as FC. (JK) Buffer lactate levels measured as an indicator of lactate secretion of (J) soleus muscles and (K) EDL muscles, n = 8 female mice per group. Data in A, H–K analyzed using independent t-tests (2-tailed), data in B analyzed using a two-way ANOVA, main effect of miR-1 KO, interaction (genotype x ETC complex), and results of post-hoc Tukey's multiple comparisons tests shown, ns: not significant, ∗p < 0.05, ∗∗p < 0.01, ∗∗∗∗p < 0.0001.
Figure 6
Figure 6
Effect of MCT4 inhibition on metabolic flexibility and exercise performance in miR-1 KO mice. (A) RER via indirect calorimetry over a 48-hr period in miR-1 KO mice administered vehicle (VEH) or VB124 (30 mg/kg) by gavage once daily (n = 5 female mice per group). WT trace from data in Figure 1 shown for comparison. (B) Box plots (min-to-max) showing median and IQR for RER data in A. (C) Whole-body oxygen consumption (VO2) and (D) locomotor activity during indirect calorimetry period. Data in A, C-D are mean ± SEM, data plotted using CalR (Ver. 2). Data analyzed using a two-way ANOVA for light and dark cycles separately. (E) Average daily running volume (km/day) over a period of 3 days in miR-1 KO mice administered VEH or VB124 by gavage once daily (n = 5 female mice per group). Data in E analyzed using an independent t-test (2-tailed), ∗∗p < 0.01.
Figure 7
Figure 7
miR-1 down-regulation during MOV-induced muscle hypertrophy. (A) Venn diagram comparing significantly up-regulated genes in miR-1 KO compared to WT (“miR-1 KO up”), significantly up-regulated genes following 3 days of synergist ablation-induced MOV compared to sham (“MOV up”), and eCLIP-seq-defined miR-1 targets (“CLIP target”). Consensus genes listed. Venn diagram generated using https://bioinformatics.psb.ugent.be/webtools/Venn/. (B) Western blot of PKM1 and PKM2 in mice subjected to sham surgery (SH, n = 13 female mice) or synergist ablation-induced mechanical overload (MOV, n = 9 female mice), (CD) Quantification of (C) PKM1 and (D) PKM2 protein levels. (E) Outline of human resistance exercise training program and times of biopsy collection (T0: baseline, T1: after the 1st training session, T13: after the 13th training session, T14: after the 14th training session). (F) miR-1 expression in human skeletal muscle biopsies (from n = 14 males) at the different time points of the resistance exercise training program. Differences in miR-1 expression at the different time points tested using a repeated-measures ANOVA with Tukey's multiple comparisons. (GH) Association between the change (Δ) in miR-1 expression and the Δ PKM1 protein levels at (G) T13 and (H) T14. (IJ) Association between miR-1 expression and PTBP1 mRNA expression at (I) T0 and (J) T13. Associations tested using simple linear regressions, p-values shown. (K) Type II fiber hypertrophy, demonstrated as percent change in Type II fiber CSA from T0 to T14. Participants divided into Low (n = 7) and High (n = 7) groups based on magnitude of CSA increases. (L) Percent change in miR-1 expression from T0 to T14 in participants in the Low and High fiber hypertrophy groups. Data in J-K analyzed using independent t-tests (2-tailed), ns: not significant, ∗p < 0.05, ∗∗p < 0.01, ∗∗∗p < 0.0001.
Figure 8
Figure 8
Summary of the effect of miR-1 loss on glycolytic and pentose phosphate enzymes and intermediates. Glycolytic and pentose phosphate pathway enzymes (ovals) and intermediates (text) depicted. Enzymes up-regulated in miR-1 KO RNA-seq or mitochondrial proteomics indicated by green color, and inactivated enzymes indicated by red color. Up-regulated metabolites in miR-1 KO metabolomics indicated by bolded green text. Green plus sign indicates positive regulation. Target symbol indicates eCLIP-seq-defined miR-1 target. Created using Biorender.com.

Update of

References

    1. Muoio D.M. Metabolic inflexibility: when mitochondrial indecision leads to metabolic gridlock. Cell. 2014;159(6):1253–1262. - PMC - PubMed
    1. Goodpaster B.H., Sparks L.M. Metabolic flexibility in health and disease. Cell Metab. 2017;25(5):1027–1036. - PMC - PubMed
    1. Merz K.E., Thurmond D.C. Role of skeletal muscle in insulin resistance and glucose uptake. Compr Physiol. 2020;10(3):785–809. - PMC - PubMed
    1. McCarthy J.J. The MyomiR network in skeletal muscle plasticity. Exerc Sport Sci Rev. 2011;39(3):150–154. - PMC - PubMed
    1. Nielsen M., Hansen J.H., Hedegaard J., Nielsen R.O., Panitz F., Bendixen C., et al. MicroRNA identity and abundance in porcine skeletal muscles determined by deep sequencing. Anim Genet. 2010;41(2):159–168. - PubMed