. 2025 Jun 9;8(1):900.
doi: 10.1038/s42003-025-08271-w.

Neural correlates of memory updating in the primate prefrontal cortex

Affiliations

Neural correlates of memory updating in the primate prefrontal cortex

Ryo Sawagashira et al. Commun Biol. .

Abstract

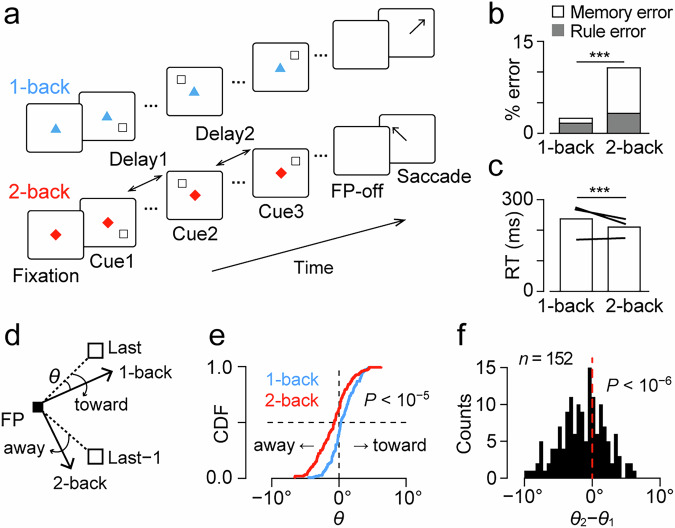
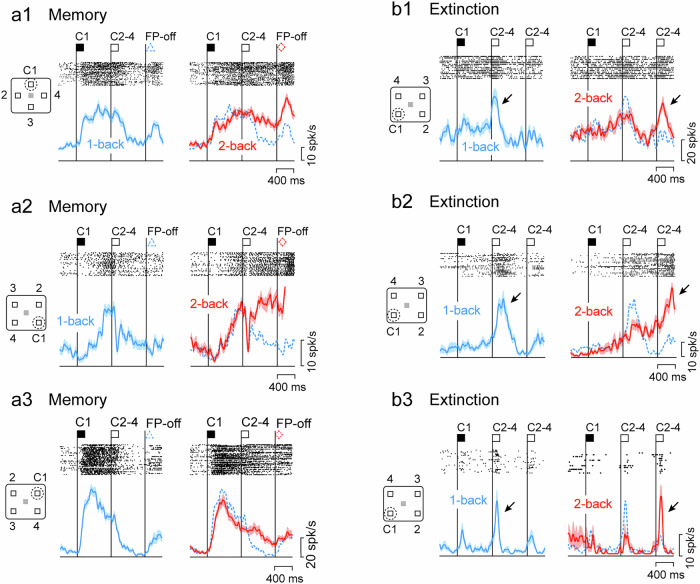
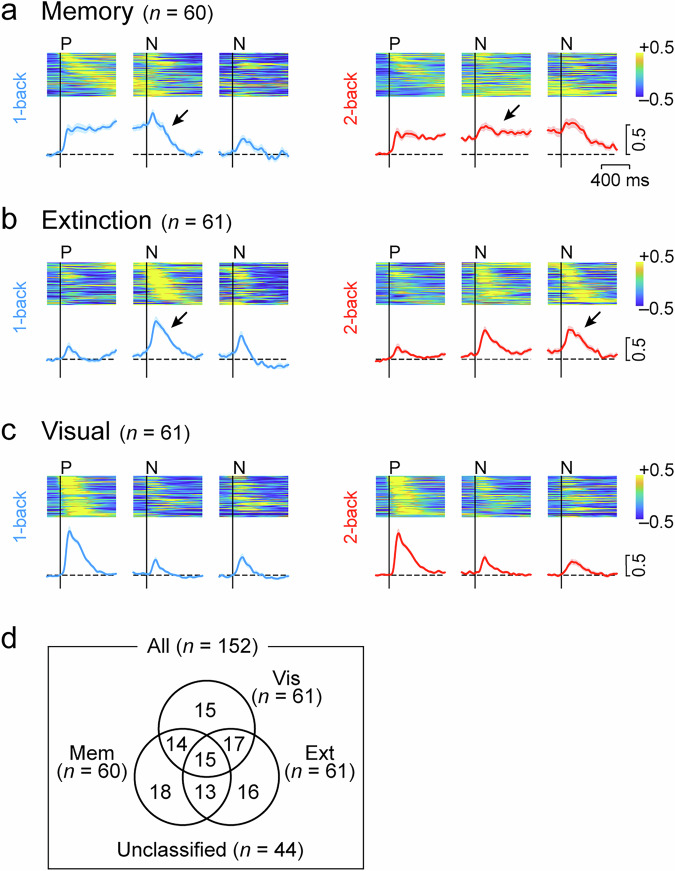
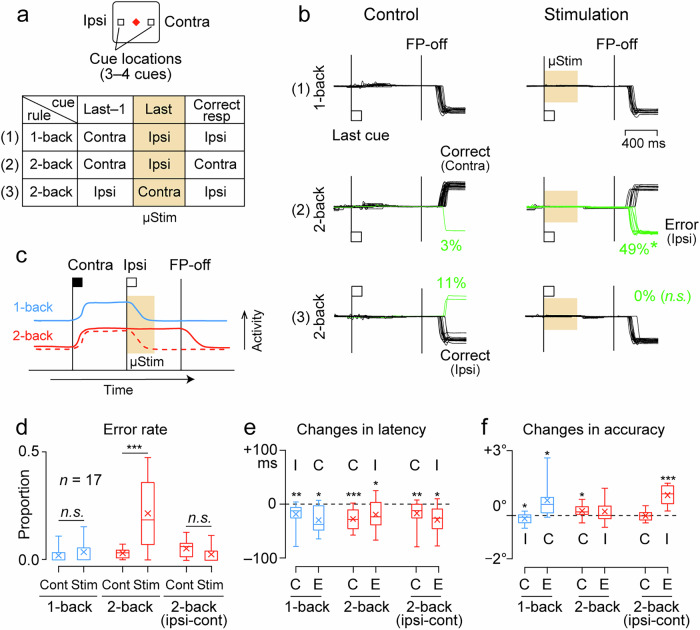
Working memory allows temporary storage and manipulation of information during cognitive tasks. While the primate lateral prefrontal cortex (PFC) is involved in working memory, little is known about neuronal activity during memory updating. We trained macaque monkeys on an oculomotor n-back task, requiring them to remember locations of sequentially presented visual stimuli and generate a saccade to the location of the most recent or previous stimulus based on task rules. Many PFC neurons showed transient activity when a memory of a particular stimulus location was no longer needed, whereas others showed sustained activity for remembered locations. Decoding analysis successfully predicted future target selection based on the task rule from neuronal activity, indicating that these neuronal populations contain sufficient information to guide behavior. Furthermore, electrical stimulation at recording sites erased specific spatial memories, demonstrating a causal role of prefrontal neurons in maintaining and updating short-term memory.


Conflict of interest statement

Competing interests: The authors declare no competing interests.

Figures

Fig. 1
Fig. 1. Behavioral paradigm and performance of monkeys.
a The oculomotor n-back task. During central fixation, two to four peripheral visual stimuli (cues) were presented sequentially with a delay of 800 ms. In response to the offset of the fixation point (FP), animals made a memory-guided saccade to one of the cue locations. When the FP was either a red triangle or a white “X”, they were required to make a saccade to the most recent cue location (1-back condition). When the FP was either a blue square or a white star, they needed to generate a saccade to the location of one previous cue (2-back condition). b Proportions of choice error in the two conditions. Stacked gray and white bars represent rule and memory errors, respectively. In the memory error trials, animals directed their eyes to locations other than the last two cues. ***p < 0.001 (paired t test). c Saccade reaction time for the two conditions. Lines indicate the data of individual monkeys. d Schematic diagram of the measurement of saccade trajectory. The white squares in the upper right and lower right indicate the locations of the most recent (Last) and one previous (Last−1) cues, respectively. Black arrows represent correct saccade trajectories in 1-back and 2-back trials. The effect of non-target cue on saccade endpoint was quantified by measuring the angle θ, with a positive value indicating the shift toward the non-target cue. FP fixation point. e The cumulative density function (CDF) of mean θ values in different conditions during recording sessions (n = 152, two sample Kolmogorov–Smirnov test, p < 10−5). f The histogram indicates the distribution of the difference in θ between conditions (2-back minus 1-back) for individual sessions. Note that the θ values in 2-back trials were significantly smaller than those in 1-back trials (one-sample t test, t151 = −5.16, p < 10−6), indicating that the endpoint of saccades moved away from the non-target cue in 2-back trials.
Fig. 2
Fig. 2. Examples of Memory and Extinction neurons in the lateral PFC.
a13 Memory neurons. For each neuron, rasters and spike density profiles in different conditions are shown in separate panels. Vertical lines labeled C and FP-off represent the time of cue appearance at the location in the inset and the offset of the fixation point, respectively. The blue dashed line on the right panel replicates the data in 1-back trials. Note that the elevated activity following the C1 decreased during the next delay period in 1-back trials but persisted in 2-back trials. b13 Extinction neurons. These neurons exhibited transient activity after the cue during the second delay period in 1-back trials (arrows), but during the third delay period in 2-back trials, indicating that it showed activity when the memory of the first cue (C1) was no longer needed.
Fig. 3
Fig. 3. Population activity of each type of neurons.
Heatmap represents the normalized activity of individual Memory (a), Extinction (b), and Visual (c) neurons in 1-back (left column) and 2-back (right) trials. Neuronal activity for 150 ms was measured in 10 ms steps. Data are aligned with the onset of the preferred cue (P) and the subsequent two non-preferred cues (N). Trials are sorted by the timing of peak activity for the preferred cue (Memory and Visual neurons) or for the subsequent non-preferred cue (Extinction neurons). The blue and red lines below indicate the normalized population activity for each condition and type of neurons. Shadow represents ± SEM. Horizontal dashed lines indicate the baseline activity before the first cue. d Number of neurons with three types of directional signals. Details of neuron classification are shown in Supplementary Fig. 2.
Fig. 4
Fig. 4. Decoding task rules from neuronal activity in correct and error trials.
a Training and test trial selection. An SVM classifier was trained on eight correct trials per condition (blue and red lines) for multiple neurons. Validation trials (black “X”) were selected randomly 100 times, and the classifier’s accuracy was the proportion of correct choices. Training data selection was repeated 100 times to compute the variation of decoding accuracy. This procedure was again repeated 100 times for each number of recruited neurons. b Cross-validated probability of correct choice as a function of the number of neurons used for the analysis. The orange line indicates the mean of the correct choice computed from neuronal activities in all four epochs (early/late D1 and D2) of correct trials. Shaded area represents SEM. The black dashed line shows the performance based on neuronal activity during the D1 period only. The dotted line indicates the results obtained from the D2 period only. The solid black line indicates the data computed from all four epochs in trials with the cues in the preferred and opposite directions. The green line with error bars (±SEM) indicates the decoding performance for shuffled data. c Contribution of each neuron type to the accuracy of decoding performance. Each bar shows the changes in the rate of correct performance due to the removal of each neuron type. Error bar indicates ± SEM. ***p < 0.001 (two-sample t test). d Activity of a Memory & Extinction neuron in correct (colored solid lines) and error (black dotted line) trials. Shadow indicates SEM for correct trials. e Visual & Memory neuron. Note that the activity in erroneous 2-back trials (2b-err) was comparable to that in correct 1-back trials (1b-cor, blue). f Choice probability (CP) of a decoder trained on correct trials, cross-validated on both correct and error trials. The performance of the decoder trained and tested with neuronal activity of all four epochs (abscissa) is compared with that of the first three epochs only (ordinate). Error bars indicate SEMs.
Fig. 5
Fig. 5. Effects of electrical stimulation on behavioral choice.
a Experimental design. Three or four visual cues were presented sequentially, 12° left or right, with an 800-ms delay. Animals generated a memory-guided saccade to the most recent or one previous cue according to the shape and color of the FP. Three stimulus conditions considered here are summarized in a table; others are shown in Supplementary Fig. 5. In half of the trials, electrical stimulation (400 ms in duration) was applied during the early part of the last delay period (orange shading). b Eye position traces in a representative session. The left and right columns show the data in control and stimulation trials, respectively. In the trials on the top and middle rows, the last cue was presented on the left (ipsilateral to the stimulation site) and the previous cue on the right (contralateral). In the trials on the bottom row, the last cue was presented on the right and the previous cue on the left. After the FP offset, the animal generated a saccade to the location of the most recent cue (1-back, top panels) or to the location of one previous cue (2-back, middle and bottom). Electrical stimulation significantly increased errors (green lines) in 2-back trials when the previous cue was presented contralaterally but not in the other conditions. The reduction of error rate in the third condition (2-back, ipsi-cont) was not statistically significant. c Possible mechanism of the stimulation effects. Solid blue and red lines illustrate the time course of Memory neuron activity in 1-back and 2-back trials, respectively. Electrical stimulation terminates sustained activity in the 2-back trials (red dashed line) and the memory of the contralateral cue is lost. d Proportion of error trials in different conditions. The box plot shows the median and quartiles and the X denotes the mean. The whiskers represent the range of the data. ***p < 0.001 (paired t test). Changes in the latency (e) and accuracy (f) of saccades due to electrical stimulation. Conventions are the same as in (d). ***p < 0.001, **p < 0.01, *p < 0.05.

Similar articles

References

    1. Goldman-Rakic, P. S. Cellular basis of working memory. Neuron14, 477–485 (1995). - PubMed
    1. Christophel, T. B., Klink, P. C., Spitzer, B., Roelfsema, P. R. & Haynes, J. D. The distributed nature of working memory. Trends Cogn. Sci.21, 111–124 (2017). - PubMed
    1. Courtney, S. M., Ungerleider, L. G., Keil, K. & Haxby, J. V. Transient and sustained activity in a distributed neural system for human working memory. Nature386, 608–611 (1997). - PubMed
    1. Curtis, C. E., Rao, V. Y. & D’esposito, M. Maintenance of spatial and motor codes during oculomotor delayed response tasks. J. Neurosci.24, 3944–3952 (2004). - PMC - PubMed
    1. Freedman, M. & Oscar-Berman, M. Bilateral frontal lobe disease and selective delayed response deficits in humans. Behav. Neurosci.100, 337–342 (1986). - PubMed

LinkOut - more resources