. 2025 Jun;57(6):1478-1492.
doi: 10.1038/s41588-025-02190-6. Epub 2025 Jun 9.

Chromothripsis-associated chromosome 21 amplification orchestrates transformation to blast-phase MPN through targetable overexpression of DYRK1A

Affiliations

Chromothripsis-associated chromosome 21 amplification orchestrates transformation to blast-phase MPN through targetable overexpression of DYRK1A

Charlotte K Brierley et al. Nat Genet. 2025 Jun.

Abstract

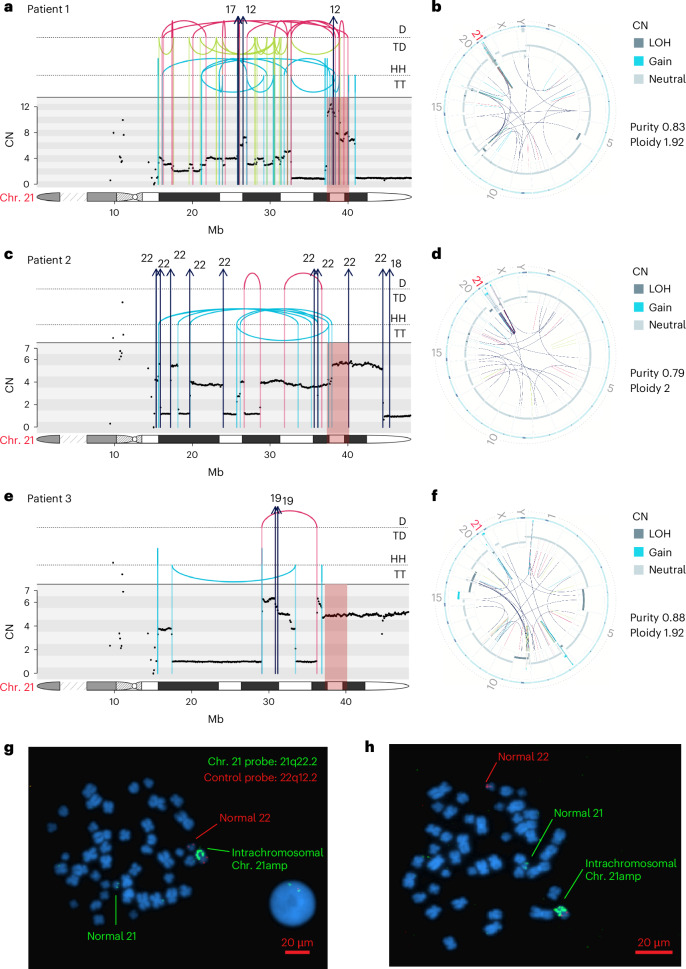
Chromothripsis, the chaotic shattering and repair of chromosomes, is common in cancer. Whether chromothripsis generates actionable therapeutic targets remains an open question. In a cohort of 64 patients in blast phase of a myeloproliferative neoplasm (BP-MPN), we describe recurrent amplification of a region of chromosome 21q ('chr. 21amp') in 25%, driven by chromothripsis in a third of these cases. We report that chr. 21amp BP-MPN has a particularly aggressive and treatment-resistant phenotype. DYRK1A, a serine threonine kinase, is the only gene in the 2.7-megabase minimally amplified region that showed both increased expression and chromatin accessibility compared with non-chr. 21amp BP-MPN controls. DYRK1A is a central node at the nexus of multiple cellular functions critical for BP-MPN development and is essential for BP-MPN cell proliferation in vitro and in vivo, and represents a druggable axis. Collectively, these findings define chr. 21amp as a prognostic biomarker in BP-MPN, and link chromothripsis to a therapeutic target.


Conflict of interest statement

Competing interests: A patent relating to the TARGET-seq technique is licensed to Alethiomics Ltd, a spin out company from the University of Oxford with equity owned by B.P. and A.J.M. E.P. is a founder, equity holder and holds a fiduciary role in Isabl Inc. A.J.C. is an employee of Owkin UK Ltd. The other authors declare no competing interests.

Figures

Fig. 1
Fig. 1. Chromothripsis-associated chr. 21amp is a recurrent and adverse prognosis genome amplification event in BP-MPN.
a, Study overview. b, log R ratio plot of chromosome 21 derived from SNP karyotyping assay (DNACopy analysis) showing chromothripsis of chromosome 21 (’chr. 21amp’) in a representative case of BP-MPN. SNP karyotyping performed for n = 64 samples. c, Graphic displaying the MAR in common across all chr. 21amp cases (n = 16). d, Boxplot of median/interquartile range (IQR) of CN overlying the chr. 21amp MAR for all cases (n = 16, the lower and upper hinge correspond to the IQR (25th and 75th percentiles), with the upper and lower whiskers extending from the hinge to ±1.5 × IQR). e, GISTIC analysis of recurrently lost (blue) and amplified (red) focal regions across all cases. Green horizontal line depicts the false discovery rate (FDR)-adjusted Q value threshold of 0.05 (n = 64). f, Boxplot of median/IQR (as in d) showing that chr. 21amp cases have a greater number of non-chr. 21 CN abnormalities compared with non-chr. 21amp cases (median 6.5 (IQR 4–10.3) versus median 1 (IQR 1–5), P = 0.0001 by two-sided Wilcoxon rank-sum test). g, Heatmap shows Pearson correlation coefficient of myeloid mutations and most frequent CNAs. Purple denotes positive co-variance, yellow negative; *Padj < 0.05. h, Kaplan–Meier analysis of patients with BP-MPN stratified by presence/absence of chr. 21amp event. Schematic in a created using BioRender.com. eLRR, estimated log R ratio; Mb, megabase. Source data
Fig. 2
Fig. 2. WGS of chromothripsis-associated chr. 21amp events at high resolution.
a,c,e, Integrated CN and SV plots showing the complex SV in three chr. 21amp cases. The top panel shows intrachromosomal events as arcs between breakpoint loci, and color denotes the type of SV (black, translocation; red, deletion; blue, duplication; green, inversion). Rearrangements are further separated and annotated based on orientation. Interchromosomal events are shown with arrows denoting the likely partner chromosome. The middle panel shows the consensus CN across the chr. 21 ideogram, depicted in the lowest section of each plot to indicate breakpoint location. b,d,f, Circos plots showing global SV burden corresponding to the patients in a, c and e, demonstrating clustering around chr. 21. The outer ring shows the chromosome ideogram. The middle ring shows the B allelic frequency and the inner ring shows the intra- and interchromosomal SVs with the same color scheme as in a, c and e. g,h, Two representative images of metaphase spreads and interphase cells from bone marrow cells from patient 3 (e and f) after FISH with two probes targeting the amplified region on chr. 21q22.2 (green) and a control region on chr. 22q12.2 (red). The chr. 21 amplification event is intrachromosomal. The experiment was performed once and 30 metaphase cells examined. Images were taken at ×1,000 magnification; scale bars, 20 μm. D, deletion; TD, tandem duplication; HH, head-to-head inverted; TT, tail-to-tail inverted.
Fig. 3
Fig. 3. Integrated RNA-seq and ATAC-seq pinpoint DYRK1A as the putative mediator of the adverse chr. 21amp phenotype.
a, TARGET-seq analysis of n = 1,903 cells from four chr. 21amp donors with allelic resolution of mutant JAK2/TP53 and chr. 21amp event in single cells enables inference of clonal hierarchy. In total, 107 cells had no genomic aberration, while 179 cells were mutated for JAK2V617F alone. Further, 162 cells were double JAK2 and TP53 mutant, with no evidence of chr. 21amp, while 1,455 cells carried all three genomic aberrations. b, Analysis of TARGET-seq gene expression data from single HSPCs enables prioritization of 5 of the 24 genes in the chr. 21amp MAR. c, Violin plots showing that DYRK1A is overexpressed in chr. 21amp HSPCs compared with non-chr. 21amp control cells including myelofibrosis (MF, n = 2,056 cells from eight MF donors), pre-leukemic stem cells (preLSC, n = 1,107 nonmutant phenotypic HSCs, identified in 12 BP-MPN donors), TP53-mutant-non-chr. 21amp BP-MPN (no chr. 21amp mTP53, n = 6,629 cells from 14 BP-MPN donors) and WT cells (n = 5,002 from nine healthy donors). Each dot represents the expression value (log2-normalized UMI count) for a single HSPC, with median and quartiles shown in white. Expressing cell frequencies are shown on the bottom of each violin plot for each group. d, Bar plot (mean ± s.e.m.) demonstrating allele-specific expression of genes in the chr. 21amp MAR. All genes with informative heterozygous SNPs (y axis; SNP information in Supplementary Table 4) demonstrated allelic skew with a read bias towards the amplified allele (red) over the WT (blue). e,f, Principal component analysis of RNA-seq (e) and ATAC-seq (f) data shows clustering by chr. 21amp status. HC samples are depicted in green, chr. 21amp BP-MPN in red and non-chr. 21amp BP-MPN in blue. g, Integration of the RNA-seq and ATAC-seq datasets comparing chr. 21amp versus non-chr. 21amp BP-MPN LinCD34+ cells identifies 125 DE genes (DEGs) and 2,252 DA peaks (DESeq2 analysis, P values (adjusted for multiple comparisons) < 0.05). Only DYRK1A is DE with a DA promoter peak. h, Volcano plot of DA peaks in DE genes comparing chr. 21amp versus non-chr. 21amp BP-MPN samples (DESeq2 analysis), y axis scaled to log10(Padj) ± 3 to highlight DYRK1A peaks. Of the 92 DA ATAC-seq peaks with log2FC > 1, 33 occur in the DYRK1A gene body. HSC, hematopoietic stem cell; UMI, unique molecular identifier.
Fig. 4
Fig. 4. Investigating the chr. 21amp-associated cell state and transcriptional landscape.
a,b, GSEA for selected KEGG and HALLMARK pathways with NES > 1 shown in the heatmap for chr. 21amp (n = 5) versus non-chr. 21amp BP-MPN (n = 4) (a) and chr. 21amp BP-MPN (n = 5) versus HC (n = 5) (b) RNA-seq datasets (Supplementary Tables 8 and 9). c, Clone-specific pseudobulk profile for a representative patient showing detection of the chr. 21amp event in single cells by the CN-calling software numbat. Each of the three plot subpanels defines a CN-defined clone, with the chromosomal location along the x axis. Each subpanel contains two sections; the top section shows the log2FC of normalized CN and the bottom panel the parental haplotype frequency (pHF), inferred from haplotype phasing of SNPs genotyped from single-cell transcriptomes. CNA calls are colored by type of alteration (amplification in red, deletion in blue, CNN-LOH in green). The red magnified box highlights the chr. 21amp event. d, UMAP representation of a healthy donor hematopoietic hierarchy of n = 6,143 HSPCs and myeloid cells. e, UMAP projection of n = 6,572 cells from two chr. 21amp BP-MPN donors onto the healthy donor hematopoietic atlas colored by chr. 21amp status (chr. 21amp cell, red; non-chr. 21amp cell, blue; HC, gray). f, Box-and-whisker plots of the percentage of CD34+ cells called as MPP and EryP based on projection analysis in e, showing expansion of MPP and depletion of EryP compared with HCs (plot shows median ± IQR with the whiskers extending ±1.5 × IQR; significance testing by paired Wilcoxon rank-sum test, n = 2 chr. 21amp BP-MPN, n = 8 non-chr. 21amp BP-MPN, n = 5 HCs). g, Barchart depicting the fraction of cells called as chr. 21amp from two chr. 21amp donors, demonstrating the differentiation block into erythroid cells. h, Violin plots of DYRK1A overexpression in chr. 21amp HSPC progenitors compared with non-chr. 21amp BP-MPN and HC cells. Each dot represents the expression value (log2-normalized UMI count) for each single cell; box-and-whiskers plot as in f. Expressing cell frequencies are shown at the bottom of each violin plot. P values by Wilcoxon rank-sum test (n = 6,143 HSPCs from HCs, n = 27,492 non-chr. 21amp BP-MPN and n = 6,572 chr. 21amp BP-MPN cells, same donors as in f). UMAP, Uniform Manifold Approximation and Projection; MkEP, megakaryocyte-erythroid progenitors; EryP, erythroid progenitors; EoBaMa, eosinophil-basophil-mast progenitors; LMPP, lymphoid-primed MPP; GMP, granulocyte-monocyte progenitors; cDC, classical dendritic cell; pDC, plasmacytoid dendritic cell; monos, monocytes; NS, not significant.
Fig. 5
Fig. 5. DYRK1A promotes cell proliferation and survival in chr. 21amp BP-MPN.
a, Western blot showing reduced DYRK1A expression in DYRK1A KO HEL cells. Densitometric values were normalized to HSC70 (representative of n = 3 experiments). b, Cell counts for cultured HEL WT and two DYRK1A KO clones (1B12 and 1A5) (mean ± s.e.m., n = 3 independent experiments in triplicate per condition, significance calculated by two-way ANOVA). c, Western blot showing the knockdown of DYRK1A expression in HEL cells with target-specific shRNA or scramble control. Densitometric values were normalized to HSC70 (representative of n = 3 experiments). d, Cell counts for transduced HEL cells in culture (mean ± s.e.m., n = 3 independent experiments in triplicate per condition, significance calculated by two-way ANOVA). e,f, Dose-dependent reduction of HEL cell proliferation in culture with the DYRK1A inhibitor EHT1610 (e) or GNF2133 (f) (n = 6 replicates, significance calculated by two-way ANOVA with Bonferroni’s post-test, mean ± s.e.m.). g, Primary patient chr. 21amp BP-MPN (n = 4) versus HC (n = 5) CD34+ and non-chr. 21amp BP-MPN (n = 4) cell viability at day 5 after treatment with 0.1 μM or 1 μM GNF2133 or 0.1 μM or 1 μM EHT1610. Boxplot shows mean ± s.e.m. Groups were compared by multiple t-tests with the Benjamini–Hochberg procedure applied to control the FDR. The FDR threshold was set at Q < 0.05. hk, Impact of DYRK1A KO on BP-MPN cells in vivo. h,j, Bioluminescent images of representative mice following transplantation of 3 × 106 luciferase-expressing WT SET2 versus DYRK1A KO clones 11H1 and 14B5 at 2 weeks (h) or WT HEL versus DYRK1A KO clones 1B12 and 1A5 cells at 3 weeks (j) (n = 5 each). In both h and j the intensity of luminescence is normalized and shown as average radiance (p s−1 cm−2 sr−1); boxplots show mean ± s.e.m., significance calculated by ANOVA and Padj values given. i,k, Kaplan–Meier survival curves of mice (n = 5 each) injected with luciferase-expressing WT SET2, DYRK1A KO clone 11H1 or 14B5 cells (i) or WT HEL, DYRK1A KO clone 1B12 or 1A5 cells (k) (significance calculated by one-sided Mantel–Cox log-rank test).
Fig. 6
Fig. 6. Amplified DYRK1A perturbs DNA damage response via regulation of the DREAM complex.
a, Volcano plot of expressed genes comparing chr. 21amp (DYRK1A upregulated n = 5) versus non-chr. 21amp (n = 5) CD34+ HSPCs, highlighting DREAM complex target genes in red. The transcriptional signature of DREAM complex DNA repair genes is downregulated. b, GSEA analysis showing downregulation of the DREAM complex DNA repair geneset in chr. 21amp BPMPN HSPCs (NES −1.74, FWER P value 0.01). c, Volcano plot of expressed genes comparing Beat AML top quintile DYRK1A expressors (n = 72) versus bottom quintile DYRK1A expressors (n = 72); the transcriptional signature of DREAM complex DNA repair genes is downregulated. d, GSEA analysis showing downregulation of the DREAM complex DNA repair geneset in BEATAML high DYRK1Ac expressors (NES −2.13, FWER P value ≤ 0.01). e,f, The transcriptional signature of DREAM complex genes involved in DNA repair is upregulated after CRISPR KO. e, Volcano plot of DE genes comparing CRISPR KO (n = 5, 2 clones) versus WT (n = 3), highlighting target genes of the DREAM DNA repair complex. f, GSEA demonstrating significant enrichment for DREAM DNA repair complex genes (NES 1.76, FWER P value 0.008). a,c,e, Genes DE by DESeq2 analysis after adjustment for multiple comparisons. g, Proliferation of CRISPR KO versus WT SET2 clones assessed by CellTitreGlo proliferation assay after 48-h treatment with indicated concentration of etoposide. Half-maximum inhibitory concentration (IC50) = 8.4 μM for DYRK1A KO and 3.3 μM for SET2 WT clones (n = 2 independent replicates). h, Percentage of cells staining positive for γH2AX by flow cytometry at 8 h post 3 μM etoposide treatment by cell type (n = 3 replicates per condition; comparison by ANOVA adjusted for multisample testing). i, Percentage of cells staining positive for γH2AX on flow cytometry at 2 h post 200-rad irradiation treatment by cell type (n = 3 replicates per condition; comparison by ANOVA adjusted for multisample testing).
Fig. 7
Fig. 7. DYRK1A upregulation is associated with activation and amplification of the JAK–STAT signaling axis and consequent upregulation of BCL2.
ac, GSEA analyses showing that the HALLMARK IL2 STAT5 geneset is downregulated in CRISPR KO (n = 5, 2 clones) versus WT (n = 3) control SET2 cells (a), and that STAT3 (b) and STAT5 (c) genesets are upregulated in chr. 21amp BP-MPN versus control cells (RNA-seq, n = 5 cases per condition, GSEA analysis (Broad Institute, adjusted for multiple comparisons)). d,e, Luciferase reporter assays for STAT5 transcriptional activity in the context of DYRK1A WT overexpression versus control. d, HEK293T cells were transfected with WT human-TPOR, murine-Jak2 WT and either empty vector (PIG EV) or CA-Stat5b and an overexpression control (OE control) or a DYRK1A WT overexpression vector (OE DYRK1A). At 24 h post transfection, Stat5b-dependent transcriptional activity with (red) or without (blue) TPO treatment at 6 h was measured by the firefly luciferase assay system with Spi-Luc reporter (STAT5 response elements) as an internal control. e, A WT Stat5b vector rather than the constitutively active form was transfected alongside Jak2V617F rather than WT Jak2. For d and e, the boxplots show mean ± s.e.m. of three independent experiments in triplicate. Significance was assessed using Tukey’s multiple comparison test. f, HOMER motif discovery analysis searching for the palindromic core STAT binding motif, demonstrating significant enrichment in chr. 21amp peaks versus background (cumulative hypergeometric distribution, adjusted for multiple comparisons). g, BCL2 gene expression is upregulated in chr. 21amp BP-MPN versus controls, assessed by RNA-seq (paired Wilcoxon rank-sum test; the box-and-whiskers plots show the median and the IQR, with the whiskers extending ±1.5 × IQR; the mean is shown as a diamond). h, Synergy matrix scores between GNF2133 (0–5 µM) and navitoclax (0–1.6 µM) treatment of HEL cells. Results represent mean percentage viability assessed by annexin V/propidium iodide staining by flow cytometry, normalized to DMSO-treated control wells for six replicates per condition. i, Schematic of proposed model of chr. 21amp driving BP-MPN transformation.
Extended Data Fig. 1
Extended Data Fig. 1. Supplemental information on copy number alterations in BP-MPN cohort and chr21amp in external AML datasets.
a. Graphical representation of all copy number gains and losses identified across the cohort by MoChA,. Events are colored by type (gain=red, loss=blue) and overlay chromosomal ideograms to indicate location. b. Number of cases by number of chromosomal alterations. Events are colored by event type (gain=red, loss=blue, CN-LOH=green). c. Mutations, TP53 allelic status, and baseline clinical data for 16 chr21amp patients. CN-LOH=Copy-neutral loss of heterozygosity, F=female, M=Male, ET=Essential Thrombocythemia, ET-MF=ET progressing to Myelofibrosis, MF=Myelofibrosis, PV=Polycythemia rubra vera, PV-MF=PV progressing to MF, Accel phase= Accelerated phase (bone marrow blast % >10 < 20%), CK=complex karyotype. d. In both the TCGA L-AML cohort and a large cohort of 3653 de novo AML patients, there was a significant enrichment for mutated and/or deleted TP53 amongst chr21amp cases (Fisher’s exact test, p=0.0000000002 for Tazi et al., p=0.002 for the TCGA comparison) e. Kaplan Meier survival curve stratified by chr21amp status showing significantly impaired overall survival (OS) for chr21amp amongst 3653 de novo AML cases (median OS from diagnosis 0.97 (95%CI 0.55-1.47) vs 1.93years (95% CI 1.77-2.09) p<0.01 by one-sided Mantel Cox log-rank test). f. Cox survival curve stratifying patients in (b) by TP53 and chr21amp status, showing that the adverse impact on survival conferred by chr21amp persists after stratifying by TP53 status (p=0.009, HR for chr21amp alone 1.3 (95% CI 1.1-1.7), mutant TP53 alone 3.75 (95%CI 3.3-4.3), HR for mTP53 with chr21amp= 4.71 (95%CI 3.3-6.8), Cox proportional hazards survival model). g. The TCGA dataset is underpowered for a survival analysis by chr21amp (median OS in years chr21amp 0.17 years (95%CI 0.17-NA) vs no chr21amp 1.58 years (95%CI 0.92-2.2), p=0.4).
Extended Data Fig. 2
Extended Data Fig. 2. Supplemental data on whole genome sequencing and multiplicity states.
a & c. integrated CN & structural variant plots for patients 4 & 5. As in Fig. 2, the top panel shows intra-chromosomal events as arcs between breakpoint loci, and color denotes the type of SV (black=translocation, red=deletion, blue=duplication, green=inversion). Rearrangements are further separated and annotated based on orientation. D: Deletion, TD: Tandem duplication; HH, head-to-head inverted, TT: tail-to-tail inverted. Inter-chromosomal events are shown with arrows denoting the likely partner chromosome. The middle panel shows the consensus copy number across the chr21 ideogram, depicted in the lowest section of each plot to indicate breakpoint location. Patient 4 has a simple breakage-fusion-bridge event, whereas patient 5 shows a low-level copy number gain and inversion event. b & d. Circos plots for patients 4 & 5 showing global SV burden, demonstrating clustering around chr21. The outer ring shows the chromosome ideogram. The middle ring shows the B allelic frequency and the inner ring shows the intra-and inter-chromosomal SVs with the same color scheme as in a & c. e. Multiplicity states across the gained copy number segment spanning DYRK1A for each case. The x-axis indicates the potential multiplicity states that would be expected to be observed for the segment spanning DYRK1A in each sample given its copy number state. Shaded bars indicate the number of mutations observed in each multiplicity state. f. Multiplicity states observed in segments spanning DYRK1A compared to the entire genome. Red shaded regions indicate the number of mutations in each multiplicity state identified in regions spanning DYRK1A for each sample. Grey shaded regions indicate the number of mutations at each multiplicity state across the entire genome, including the segment spanning DYRK1A. The red and grey bars overlap, rather than being additive. There were insufficient mutations in the region of amplification to assess multiplicity in Patient 5.
Extended Data Fig. 3
Extended Data Fig. 3. Supplemental information on prioritising genes in the minimally amplified region using TARGET-seq.
a.-d. Violin plots of the significantly DE genes in the MAR (log2FC>1, padj<0.05) in chr21amp HSPCs compared to non-chr21amp control cells including myelofibrosis (MF, n=2056 cells from 8 MF donors), pre-leukemic stem cells (preLSC, n=1107 non-mutant phenotypic HSC, identified in 12 BP-MPN donors), TP53-mutant-non-chr21amp BP-MPN (no chr21amp mTP53, n=6629 cells from 14 BP-MPN donors) and wild type cells (WT, n=5002 from 9 healthy donors). Each dot represents the expression value (log2-normalized UMI count) for each single cell, with median and quartiles shown in white. Expressing cell frequencies are shown on the bottom of each violin plot for each group a. PIGP b. TTC3 c. MORC3 d. DSCR3. For each gene, padj<0.001 when comparing chr21amp_TP53_MT vs all other categories by Wilcoxon rank sum test, adjusted for multiple comparisons by Bonferroni correction. e-i. Box plots showing differential expression of prioritised genes (e. DYRK1A f. PIGP g. TTC3 h. MORC3 i. DSCR3) in the chr21 MAR for AML patients with copy number data available in The Cancer Genome Atlas (n=134 non-chr21amp, n=9 chr21amp) by Wilcoxon rank sum test, adjusted for multiple comparisons by Bonferroni correction. The box-and-whiskers plots show the median and the interquartile range (IQR), with the whiskers extending +/-1.5*IQR. The mean is shown as a diamond.j. Box-and-whiskers plot of normalised counts (log2CPM+1) of DYRK1A expression on RNA_seq analysis, showing mean (diamond), median and IQR, with the whiskers extending +/-1.5*IQR. DYRK1A is overexpressed in chr21amp cases compared to controls (Wilcoxon rank-sum test, p<0.05 for all comparisons). k. ATAC-seq tracks shown in UCSC genome browser window over the DYRK1A genomic location by condition (chr21amp in red, healthy control in green, non-chr21amp BP-MPN in blue) with differentially accessible (log2FC >1, p-adj < 0.05, DESeq2 analysis) peaks marked with a red star.
Extended Data Fig. 4
Extended Data Fig. 4. DYRK1A expression in external AML datasets and DYRK1A-amplification associated gene regulatory programmes.
a. In the 360-patient BEAT AML cohort, overexpression of DYRK1A is associated with adverse outcome (HR 1.44 (95% CI 1.07-1.93, p-value 0.03), Cox regression analysis, 3year (y) OS 13.1% (95%CI 7.1-24.4%) vs 28.4%(95%CI 18.8-43.1%, p=0.02, Mantel–Cox log-rank test), while ERG and ETS2, two other genes in the chr21amp minimally amplified region, are not (b.: ERG 3y OS ERG high 16.7% (95%CI 9.3-30.1%) vs 22.0% low (95%CI 13.7-35.4%), p=0.8 Mantel–Cox log-rank test) c., ETS2 3y OS ETS2 high 19.1%(95%CI 13.2-31.2%) vs 20.3% ETS2 low (95%CI 10.5-34.8%, p=0.2 Mantel–Cox log-rank test)) d. BEATAML cohort stratified by top (n=72) vs bottom (n=72) quintile of DYRK1A expression e. Heatmap of top differentially expressed genes of top vs bottom quintiles of the BEAT AML cohort stratified by DYRK1A expression. f. Hallmark and KEGG pathway GSEA of top altered pathways (NES, Normalized enrichment score >/<1) comparing patients in (d.) g. GSEA for HALLMARK pathways with normalized enrichment score (NES)><1 in chr21amp vs non-chr21amp HSCs. The heatmap shows the normalized enrichment score and the title indicates the cohort that the geneset is enriched/depleted for. Raw data can be found in Supplementary Table 10. h. Heatmap of SCENIC regulon analysis showing that chr21amp and DYRK1A overexpression leads to activation of divergent transcriptional programs. Regulons cluster by chr21amp status over cell type, when comparing chr21amp BP-MPN and non-chr21amp BP-MPN with healthy controls. STAT5A and STAT5B regulons are upregulated in a cell-type agnostic manner by chr21amp, while TP53 is downregulated. i. SCENIC regulons scored by the AUCell algorithm upregulated in chr21amp include STAT5A, STAT5B and SOX4, with TP53 downregulated, corroborating the GSEA findings. Statistical significance testing performed by Kruskal Wallis test with Benjamini Hochberg adjustment for multiple testing. j. Plot of DYRK1A gene expression vs gene dependency from the Broad DepMap database, showing the chr21amp MPNAML cell line HEL as an outlier. The non-chr21amp K562 leukemia cell line is also labelled. Linear regression analysis shows correlation between expression and dependency (Pearson correlation coefficient -0.242, slope -5.67E-1, p-value <0.001) k. mRNA expression of DYRK1A by cell line lineage in the DepMap database. l. Ceres gene dependency scores for DYRK1A by cell line lineage in DepMap.
Extended Data Fig. 5
Extended Data Fig. 5. Supplemental experiments functionally validating DYRK1A as a target in BP-MPN.
a. Cell counts for two SET2 DYRK1A KO clones (14B5 & 11H1) generated by CRISPR/Cas9 and expanded in culture, confirming adverse effect on proliferation by DYRK1A KO over time (Shown are mean +/- SEM, n=3 biological replicates, p<0.05 by day 5 by ANOVA). b. Western blot showing the knockout of DYRK1A in the 14B5 & 11H1 SET2 cell clones. Densitometric values normalized to HSC70 (representative of n=3 experiments). c. Cell proliferation assay for SET2 cells transduced with lentiviruses expressing DYRK1A specific shRNA or scramble control (Shown are mean +/- SEM, n=3 biological replicates, p<0.05 by day 5, by ANOVA). d. Western blot showing the knockdown of DYRK1A expression in SET2 cells following transduction with lentiviruses expressing target specific shRNA or scramble control. Densitometric values were normalized to actin (representative of n=3 experiments). e. Independent replicate experiment of shRNA knockdown experiments. HEL cells were treated with lentiviruses expressing DYRK1A specific shRNA or scramble control, and placed in the Incucyte for serial cell counts (summary of 3 biological replicates, mean +/- SEM, p<0.001 by ANOVA). f. Knockdown of DYRK1A was validated by qRT-PCR (n=3 replicates, shown are mean +/- SEM, compared by t-test, p-values shown are two-sided). g. Western blots for phosphorylation of LIN52 at S28, FOXO1 at S329, total LIN52 and total FOXO1 protein levels after 4 hours of treatment with increasing doses of the DYRK1A inhibitor EHT1610 in SET2 cells are shown. Densitometric values were normalized to HSC70 and GRB2 protein levels, respectively (representative of n=2 experiments). h. Experimental layout for primary patient experiments. i. Timecourse of viability readouts for primary patient cells on days 1,5,8 post treatment with DYRK1A inhibitors EHT1610 and GNF2133 at 0.1 and 1μM doses. On the y axis is % cell death relative to DMSO control. Each sample (n=5 healthy controls, n=4 non-chr21amp and n=4 chr21amp patients) is shown by a dot, with mean and SD depicted in the boxplot. Significance testing by t-test with Bonferroni correction for multiple testing, shown are the adjusted q values *<0.1 **<0.05, ***<0.001.
Extended Data Fig. 6
Extended Data Fig. 6. Supplemental data on DYRK1A and genomic instability.
a. Schematic diagram summarising the proposed model whereby DYRK1A overexpression impacts DNA damage response and genomic instability. b. Representative flow cytometry plots showing % of SET2 WT and SET2 DYRK1A KO cells staining positive for γ- H2AX at 8hrs post 3μM etoposide treatment.
Extended Data Fig. 7
Extended Data Fig. 7. Supplemental experiments evaluating the mechanism of DYRK1A and the concomitant upregulation of BCL2, supporting a rationale for therapeutic synergy with co-inhibition of DYRK1A and BCL2.
a. Volcano plot of differentially expressed genes on RNA-seq of SET2 cell lines who underwent CRISPR KO of DYRK1A (n=5, 2 clones) vs WT (n=3) highlighting downregulation of HALLMARK STAT5 signalling pathway genes (GSEA NES -2.08, FWER p-value <0.01, DESeq2 analysis). b. Western blot for phosphorylation of STAT3 at Y705 and total STAT3 with actin normalization, at baseline and after 30 minutes of treatment with increasing doses of the DYRK1A inhibitor EHT1610 in HEL and SET2 cells. Blot representative of n=2 experiments. c. Co-dependencies for DYRK1A in DepMap, highlighting BCL2 amongst the top 10 genes co-dependent on CRISPR screen (Pearson’s correlation co-efficient 0.24). d. DYRK1A KO SET-2 cell line clones downregulate BCL2 (n=5 CRISPR KO vs n=3 WT, p-0.02 Wilcoxon rank-sum test. The box-and-whiskers plots show the median and the interquartile range (IQR), with the whiskers extending +/-1.5*IQR. The mean is shown as a diamond.). e. ATAC-seq peaks in chr21amp vs non-chr21amp cells showing upregulation of peaks across the BCL2 gene body in chr21amp patients (n=5 chr21amp vs n=4 non-chr21amp vs n=5 healthy controls, two-sided paired Wilcoxon rank-sum test. The box-and-whiskers plots show the median and the interquartile range (IQR), with the whiskers extending +/-1.5*IQR. The mean is shown as a diamond.). f. Representative flow cytometry plots for Annexin V PI apoptosis assay demonstrating synergy between the DYRK1A inhibitor GNF2133 (‘GNF”) and the BCL2/BCL-XL inhibitor navitoclax (“NAV”). The middle left panel shows that GNF1 μM induces apoptosis in 9.4% of cells while NAV 100nM does so in 22.6% of cells (top right). In combination (bottom left), NAV 100+GNF induce apoptosis in 46.1%. g. Bliss synergy score and matrix contour plot highlighting areas of greatest synergy between DYRK1A and navitoclax inhibitor dosing.
Extended Data Fig. 8
Extended Data Fig. 8. Details on FACS gating.
a. Sorting strategy for mini-bulk RNA, ATAC and 10X single cell RNA-seq experiments: Lineage-CD34+ cells were sorted for subsequent library preparation for data shown in Fig. 3, Fig. 4, Fig. 5g, Extended Data Figs. 3 and 7f. b. Gating strategy for Annexin V/PI apoptosis staining experiments shown in Fig. 7h and Extended Data Fig. 7g. MNCs: Mononuclear cells, FSC-A: Forward Scatter Area, SSC-A: Side Scatter Area, FSC-H: Forward-Scatter Height, 7-AAD: 7- aminoactinomycin D.

Update of

References

    1. Cortés-Ciriano, I. et al. Comprehensive analysis of chromothripsis in 2,658 human cancers using whole-genome sequencing. Nat. Genet.52, 331–341 (2020). - PMC - PubMed
    1. Aaltonen, L. A. et al. Pan-cancer analysis of whole genomes. Nature578, 82–93 (2020). - PMC - PubMed
    1. Korbel, J. O. & Campbell, P. J. Criteria for inference of chromothripsis in cancer genomes. Cell10.1016/j.cell.2013.02.023 (2013). - PubMed
    1. Saha, C., Attwell, L., Harrison, C. N. & McLornan, D. P. Addressing the challenges of accelerated and blast phase myeloproliferative neoplasms in 2022 and beyond. Blood Rev.10.1016/j.blre.2022.100947 (2022). - PubMed
    1. Bewersdorf, J. P. & Rampal, R. K. Hitting the brakes on accelerated and blast-phase myeloproliferative neoplasms: current and emerging concepts. Hematology2022, 218–224 (2022). - PMC - PubMed

MeSH terms

Substances

LinkOut - more resources