. 2025 Jul;26(14):3640-3662.
doi: 10.1038/s44319-025-00493-7. Epub 2025 Jun 9.

Regulated microexon alternative splicing in single neurons tunes synaptic function

Affiliations

Regulated microexon alternative splicing in single neurons tunes synaptic function

Bikash Choudhary et al. EMBO Rep. 2025 Jul.

Abstract

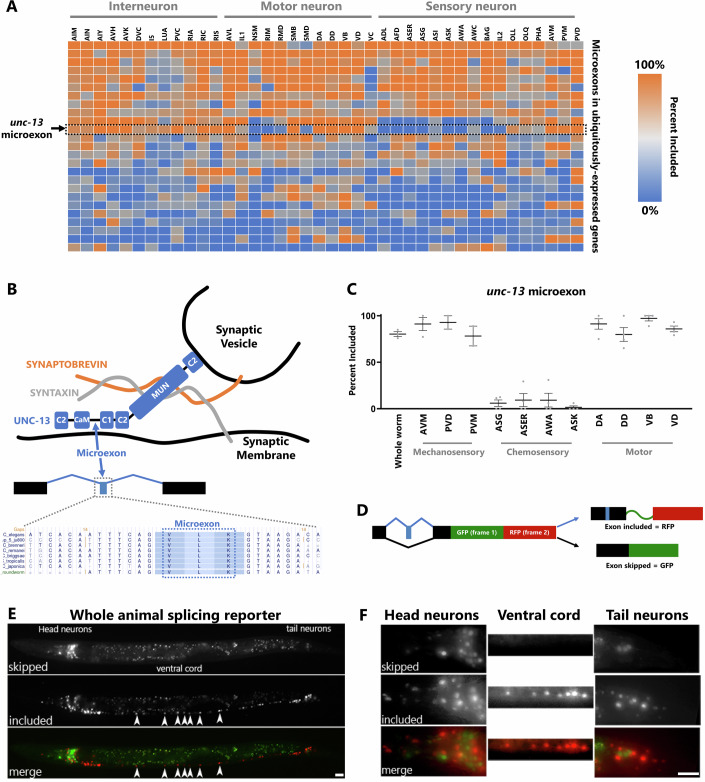
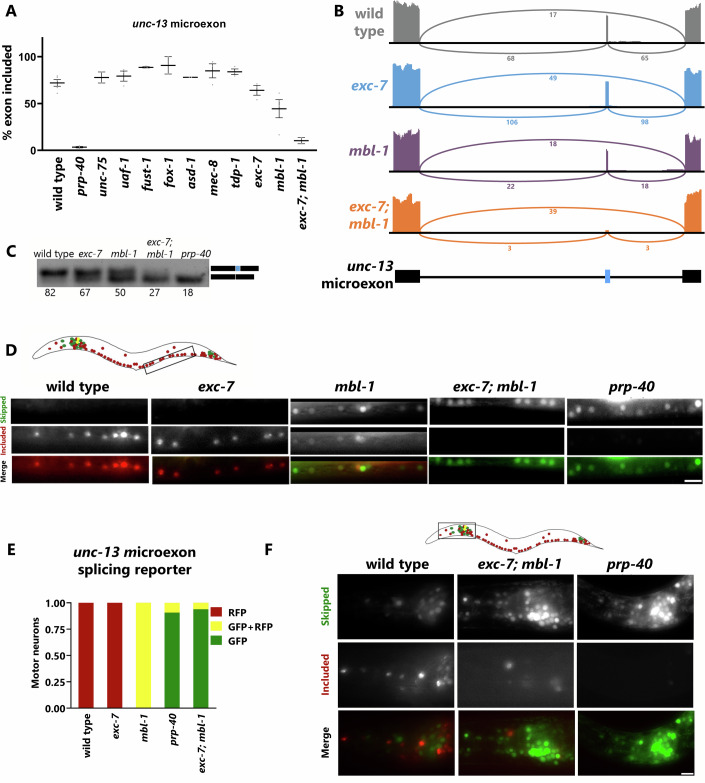
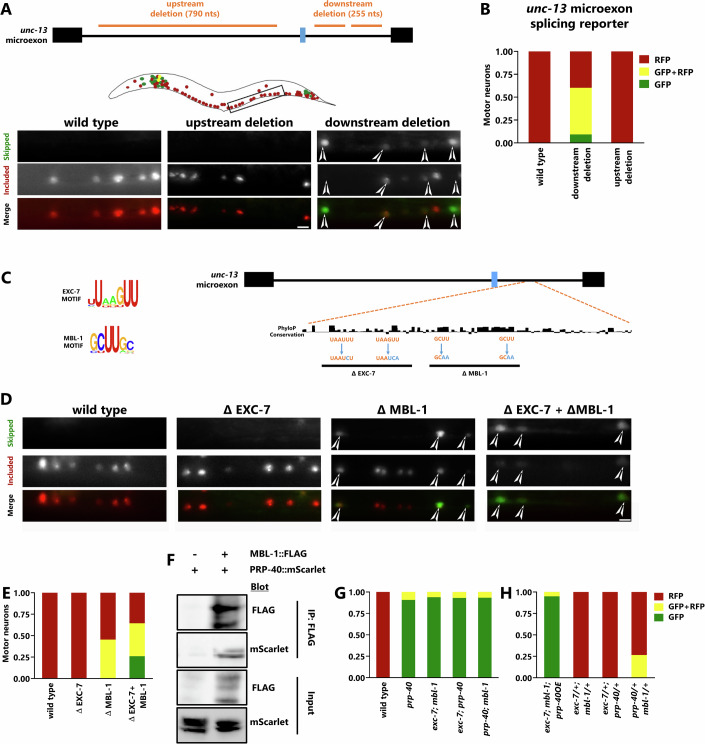
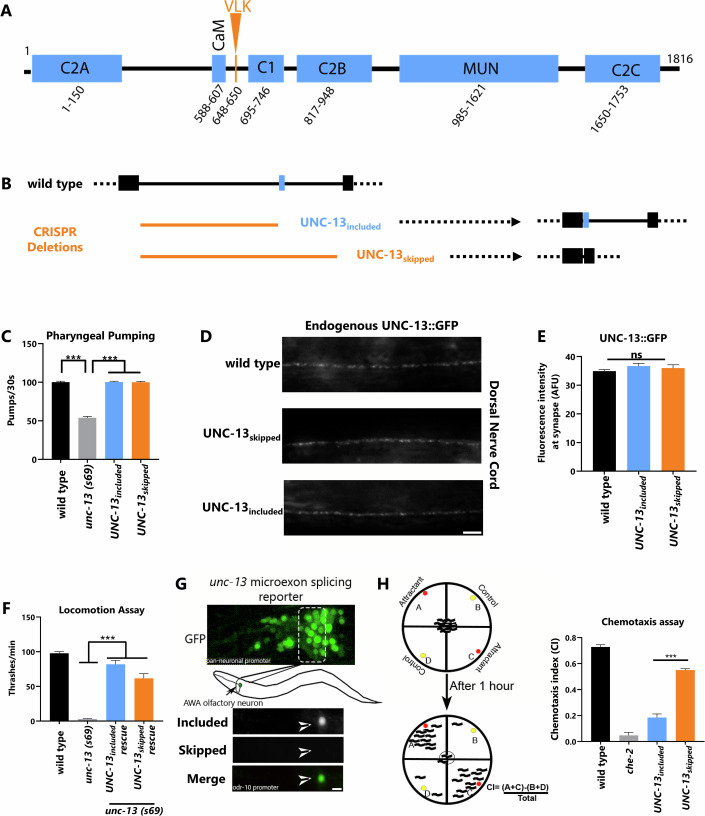
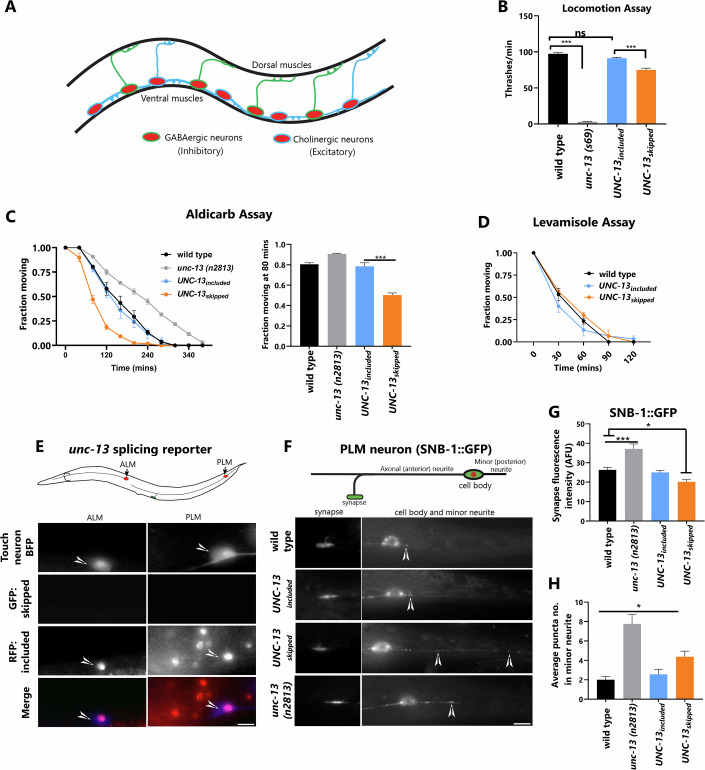
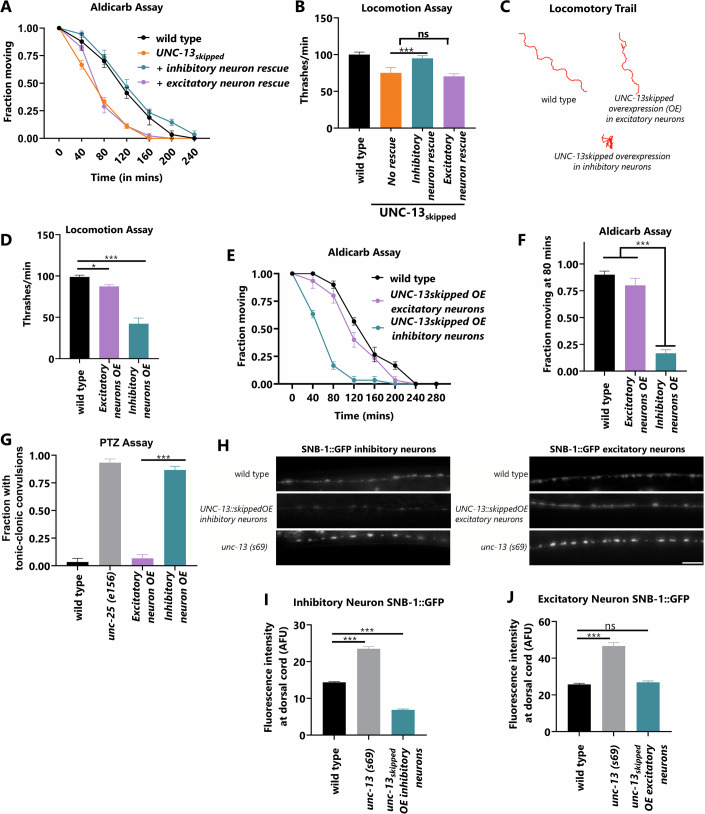
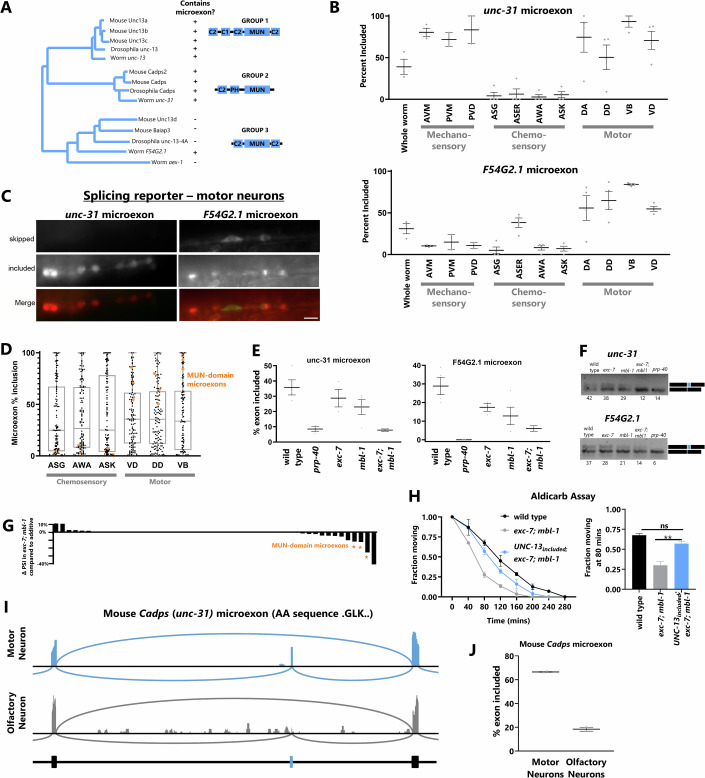
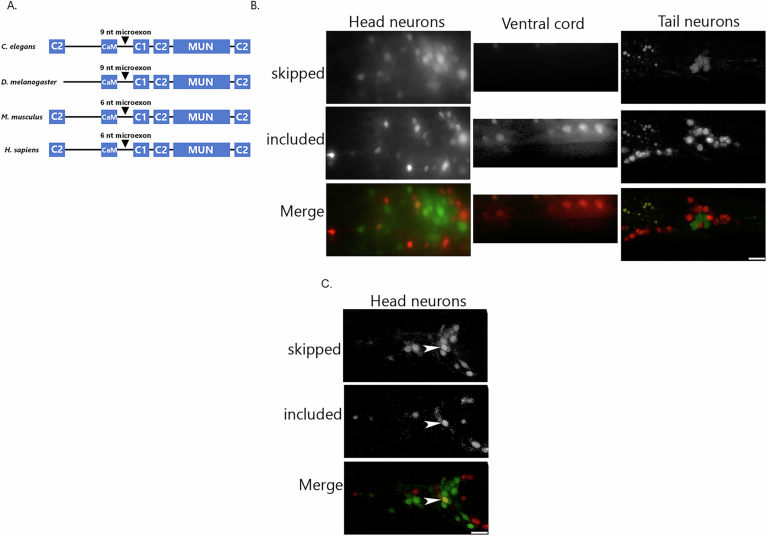
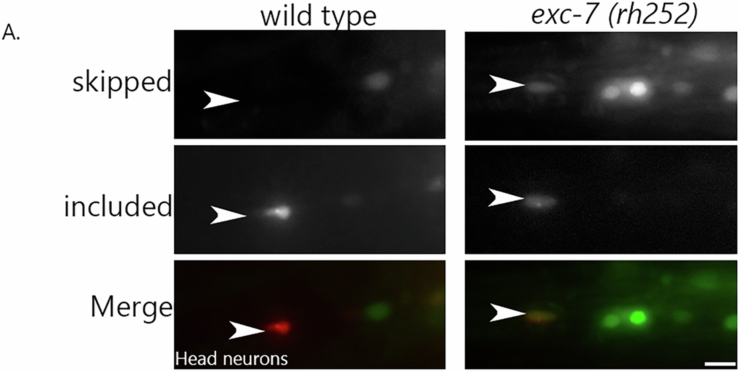
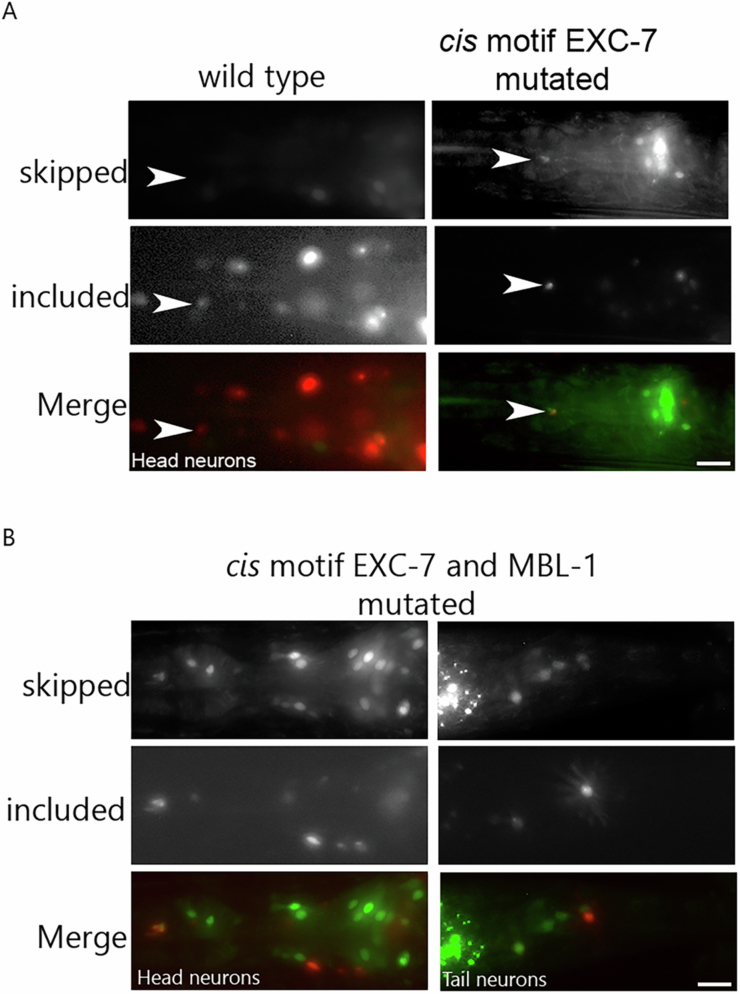
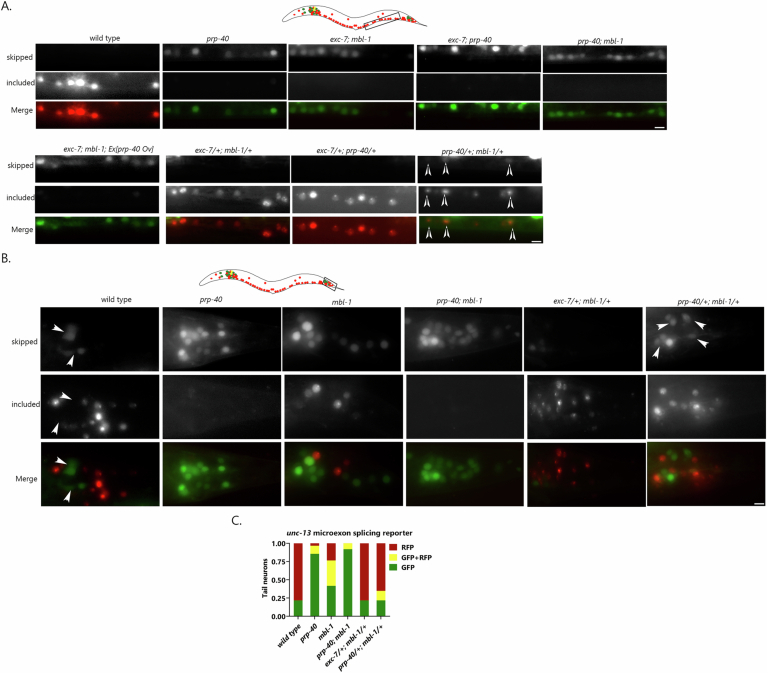
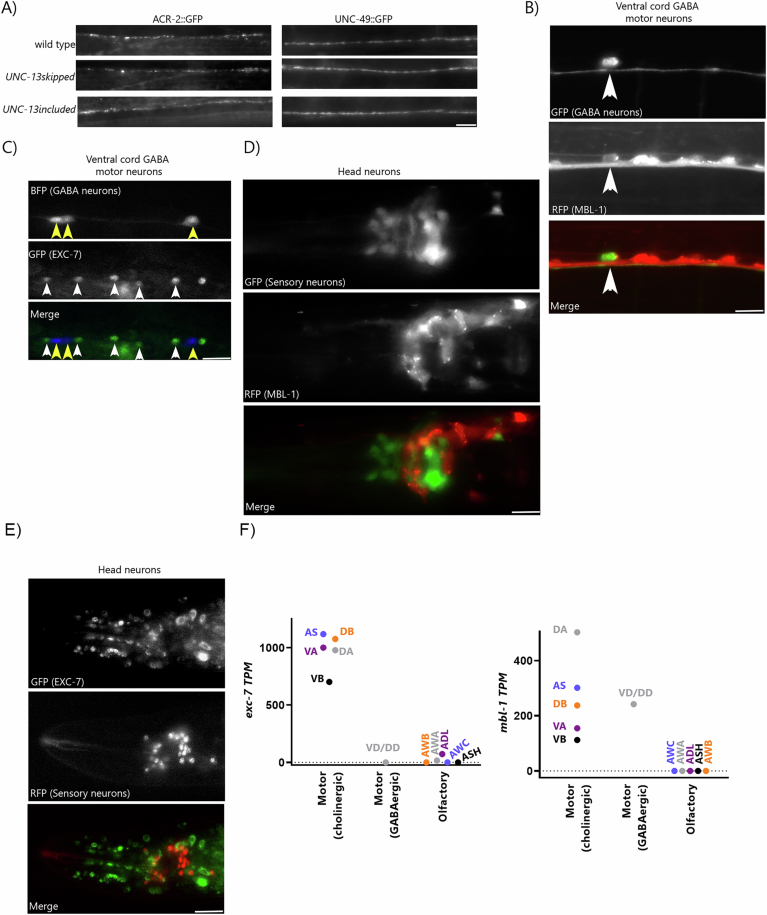
Microexons are important components of the neuronal transcriptome. Though tiny, their splicing is essential for neuronal development and function. Microexons are typically included in the nervous system and skipped in other tissues, but less is known about whether they are alternatively spliced across neuron types, and if so what the regulatory mechanisms and functional consequences might be. We set out to globally address this question in C. elegans using deep single-cell transcriptomes and in vivo splicing reporters. We find widespread alternative microexon splicing across neuron types. Focusing on a broadly-conserved 9-nucleotide exon in the synaptic vesicle gene unc-13, we find that it is completely skipped in olfactory neurons, but completely included in motor neurons. This splicing pattern is established by two neuronal RNA binding proteins which recruit spliceosomal component PRP-40 to mediate microexon inclusion. Cell-specific microexon alternative splicing is functionally important, as forcing microexon inclusion causes olfactory defects, while forcing microexon skipping causes locomotory defects. These locomotory defects are caused by decreased inhibitory motor neuron synaptic transmission and altered synaptic vesicle distribution. Regulatory features of unc-13 microexon splicing are broadly conserved: related MUN-domain genes in worms, flies, and mice invariably encode microexons, and those we tested are subject to similar regulatory principles (e.g. included in motor neurons, skipped in olfactory neurons, and regulated by the same two RNA binding proteins). Thus, not only is microexon inclusion important for nervous system function, but microexon alternative splicing across neurons is important for tuning neuronal function in individual cell types.

Keywords: unc-13; Alternative Splicing; Microexon; Neuron; Splicing.


Conflict of interest statement

Disclosure and competing interests statement. The authors declare no competing interests.

Figures

Figure 1
Figure 1. Microexon alternative splicing across neuronal cell types.
(A) Heat map displaying % inclusion for all alternatively spliced microexons in pan-neuronally expressed genes. Arrow denotes the unc-13 microexon studied in this paper. (B) Schematic of UNC-13 protein depicting its conserved domains, relative position of the microexon, and role in the release of synaptic vesicles at synapse. Below is a depiction of microexon conservation across nematode species. (C) Quantification of percent inclusion of unc-13 microexon in different neuronal subtypes (mechanosensory, chemosensory and motor neurons) from CeNGEN RNA-Seq data (Taylor et al, 2021). n ≥ 2 independent RNA-Seq experiments. Error bars display the standard error to mean (SEM). (D) Schematic of the bicolor splicing reporter. Inclusion of the alternative microexon (in blue) results in RFP expression, while exclusion leads to GFP expression. (E) Representative image of a transgenic animal expressing the unc-13 microexon bicolor splicing reporter under a pan-neuronal promoter. Ventral cord neurons (white arrowheads) only express the included version of unc-13 microexon. (F) Splicing pattern of the unc-13 microexon in different regions of the C. elegans nervous system (head neurons, nerve cord, and tail neurons). Note that the wild-type control panel is the same worm as in Figs. 2D and EV4A. Each distinct puncta is an individual cell body. Scale bar 20 µm. Source data are available online for this figure.
Figure 2
Figure 2. Cell-specific splicing of unc-13 microexon is regulated by the neuronal RBPs EXC-7 and MBL-1.
(A) Percent inclusion for unc-13 microexon in existing RNA Seq data for mutants of neuronal RBP genes. n ≥ 2 independent RNA Seq experiments. All mutants are predicted to be molecular nulls (deletions) except for uaf-1, which is a hypomorphic allele. Error bars display the SEM. (B) Sashimi plots of unc-13 microexon from whole animal RNA Seq data for wild type, exc-7 (csb28), mbl-1 (csb31) and exc-7 (csb28); mbl-1 (csb31). (C) RT-PCR of unc-13 microexon alternative splicing in mutant genotypes. Upper band is microexon included, lower band is microexon skipped. Numbers below each band represent % inclusion values determined by gel densitometry. (D) unc-13 microexon splicing reporter in ventral cord neurons (neuron locations demarcated in cartoon above) in wild type, mbl-1 (wy560), exc-7 (rh252), and prp-40 (csb3) mutants. Note that the wild-type control panel is the same worm as in Figs. 1F and EV4A. (E) Quantification of the splicing pattern in ventral cord neurons in the genotypes indicated, n = 10–15 animals. (F) Representative images of head neurons for wild type, exc-7 (rh252); mbl-1 (wy560) and prp-40 (csb3) animals expressing unc-13 microexon-splicing reporter. Inclusion of microexon is almost completely lost in both exc-7 (rh252); mbl-1 (wy560) and prp-40 (csb3) genotypes. Scale Bar 10 µm. Source data are available online for this figure.
Figure 3
Figure 3. Regulatory mechanisms underlying cell-specific alternative splicing of unc-13 microexon.
(A) Upper panel: Schematic of unc-13 microexon with surrounding introns and constitutive exons, orange lines denote transgene deletions. Conserved regions we hypothesized to be necessary for basal splicing machinery were left undeleted, as displayed (for this reason, the downstream intron is a bipartite deletion of 255 nts). Lower panel: representative images of motor neurons expressing unc-13 microexon splicing reporter with intronic deletions. White arrowheads indicate the appearance of GFP in ventral cord neurons. Downstream intron deletions, but not upstream deletions, cause increased microexon skipping. (B) Quantification of the splicing pattern in ventral cord neurons expressing the modified unc-13 microexon splicing reporter of Fig. 3A. (C) Left panel: in vitro-derived motifs for EXC-7 and MBL-1 as reported from RNA compete data. Right panel: EXC-7 and MBL-1 cis elements present in the downstream intron. PhyloP conservation scores are displayed, and the cis element mutations generated are marked in blue. (D) Representative images of ventral cord neurons expressing the abovementioned cis-element-mutated splicing reporters. The white arrowhead marks the appearance of GFP in the ventral cord neurons. (E) Quantification of experiments displayed in 3D. (F) Biochemical interaction of PRP-40::mScarlet with MBL-1::Flag. MBL-1::Flag was pulled down by anti-flag, and the blot was probed for PRP-40::mScarlet (right lane). As a control, PRP-40::mScarlet lysate was incubated with anti-flag (left lane). (G, H) Quantification of genetic interaction (G) and double heterozygote analysis (H) by quantifying splicing reporter in the ventral cord, as in panel (E). Also refer to Fig. EV4. Graphs, n = 10–15 animals. Scale Bar 10 µm. Source data are available online for this figure.
Figure 4
Figure 4. unc-13 forced-isoform mutants reveal a requirement for microexon skipping in olfactory neurons.
(A) Conserved UNC-13 protein domains and corresponding C. elegans amino acids #s. The unc-13 microexon, encoding amino acids “VLK,” is situated between CaM and C1 domains. (B) CRISPR-mediated genomic modifications (orange lines) to fuse the unc-13 microexon to the upstream constitutive exon (UNC-13included) or to remove the microexon entirely (UNC-13skipped). (C) Pharyngeal pumping is reduced in unc-13 (s69), a null allele, as previously reported (Kohn et al, 2000), but unaffected in either UNC-13skipped and UNC-13included strains. One-way ANOVA with multiple comparison analysis was performed. p values are displayed as padjusted (padj) and shown as follows: ns (non-significant) = padj > 0.05, *padj < 0.05, **padj < 0.01, ***padj < 0.001. padj value from L (left) to R (right): padj < 0.0001, padj < 0.0001. Error bars display the SEM. (D) Representative images of dorsal cord showing localization of endogenously GFP-tagged UNC-13. (E) Fluorescence quantification of the puncta in (D). One-way ANOVA with multiple comparison analysis was performed. ns = padj > 0.05. Error bars display the SEM. (F) Locomotory behavior as assessed by thrashing assays. Overexpressing either the skipped or included unc-13 isoform rescues the loss-of-function phenotype. One-way ANOVA with multiple comparison analysis was performed. padj < 0.0001. Error bars display the SEM. (G) Upper panel, image of the nerve ring neurons, showing many neuronal cell bodies expressing the skipped version of unc-13. Many sensory neurons are situated in this region (dotted white rectangle). Middle panel: worm schematic showing the position of the AWA olfactory neuron marked by a black arrow. Bottom panel: representative image of unc-13 microexon splicing reporter expressed in the AWA neuron via odr-10 promoter as marked by white arrowhead. (H) Schematic of olfaction assay (left panel) used for pyrazine assay. The chemotaxis index (CI) is calculated as shown in the figure. Right panel: UNC-13included exhibits strong olfactory defects to 1 mM pyrazine. che-2 (e1033) used as a chemotactic control (Bargmann et al, 1993). Unpaired t-test performed. p < 0.0001. Error bars display the SEM. Chemotaxis assay n = 3 biological replicates, 50–75 animals each. Other graphs, n = 10–20 animals. Scale bar = 10 µm. Source data are available online for this figure.
Figure 5
Figure 5. unc-13 microexon inclusion is required for motor neuron function and synaptic vesicle localization.
(A) Cholinergic and GABAergic ventral cord motor neurons and their synaptic connections are made in the dorsal and ventral muscle. These drive the sinusoidal movement of the animal, orchestrated by alternate contraction and relaxation of the ventral and dorsal muscles driven by excitatory (cholinergic) and inhibitory (GABAergic) neurons. (B) Quantification of locomotion as determined by thrashing assays. One-way ANOVA with multiple comparison analysis was performed. padj value from L to R: padj < 0.0001, ns = padj = 0.0965, padj < 0.0001. Error bars display the SEM. (C) Left panel, aldicarb response curve. UNC-13skipped animals are aldicarb hypersensitive, whereas unc-13 (n2813) loss-of-function animals are aldicarb resistant, as previously reported (Kohn et al, 2000). Right panel, quantification of the fraction of animals moving at 80 min. Unpaired t-test performed. p < 0.0001. Error bars display the SEM. (D) Response curve for levamisole assay. No significant difference was found among genotypes. (E) Upper panel: Schematic of worm showing position of PLM and ALM mechanosensory neurons by black arrow. Lower panel: Representative images of animals with mechanosensory neurons marked by mec-7p::BFP reporter, co-expressing unc-13 splicing reporter. The white arrowhead marks the ALM and PLM neurons. Mechanosensory neurons exclusively express microexons, including the unc-13 isoform. (F) Upper panel: schematic of PLM neuron cell body, long neurite (axonal neurite) with synapses, and minor neurite ending in the tail region. Lower Panel: representative images of SNB-1::GFP localization at the presynaptic region (left panel) and minor neurite (right panel). White arrowheads mark SNB-1::GFP puncta in minor neurites. (G, H) Quantification of the intensity of SNB-1::GFP cluster at presynaptic region (G) and puncta number in the minor neurite (H). One-way ANOVA with multiple comparison analysis was performed. padj value from L to R for (G): padj < 0.0001, padj = 0.02 and for (H): padj = 0.02. Error bars display the SEM. n = 15–20 animals. Scale bar 10 µm. Source data are available online for this figure.
Figure 6
Figure 6. Inhibitory motor neurons are particularly sensitive to loss of unc-13 microexon inclusion.
(A) Aldicarb response curve for UNC-13skipped and for cell-specific cDNA overexpression (OE) of UNC-13 included in the UNC-13skipped background. Expression in GABAergic neurons restores aldicarb sensitivity. (B) Thrashing assay reveals rescue of UNC-13skipped by expression of UNC-13 included cDNA in GABAergic neurons. One-way ANOVA with multiple comparison analysis was performed. padj value from L to R: padj < 0.0001, ns = padj = 0.38. Error bars display the SEM. (C) Representative worm tracks generated for UNC-13skipped cDNA OE in wild-type worms. OE in inhibitory neurons causes a range of locomotory phenotypes, from mild to strong (displayed track is representative of strong phenotype). OE in excitatory neurons shows no such phenotypes. (D) Thrashing quantification of UNC-13skipped cDNA OE in a wild-type background. One-way ANOVA with multiple comparison analysis was performed. padj value from L to R: padj = 0.012, padj < 0.0001. Error bars display the SEM. (E) Aldicarb response curve for cell-specific OE of UNC-13skipped cDNA. (F) Quantification of the percentage of moving animals from (E) moving at 80 min. One-way ANOVA with multiple comparison analysis was performed. padj < 0.0001. Error bars display the SEM. (G) Quantification of tonic-clonic convulsion behavior at 45 mins for PTZ assay. Wild type and unc-25 (e156) act as negative and positive controls, respectively. For this assay, mild to strong unc animals were selected for UNC-13skipped OE in inhibitory neurons. One-way ANOVA with multiple comparison analysis was performed. padj < 0.0001. Error bars display the SEM. (H) Representative images of SNB-1::GFP expressed in the dorsal cord of inhibitory (left panel) and excitatory (right panel) neurons. SNB-1::GFP puncta are reduced in mild to strong unc animals with UNC-13skipped OE in inhibitory neurons. Scale bar 10 µm. (I, J) Quantification of SNB-1::GFP puncta intensity in the dorsal cord of GABAergic (I) and cholinergic (J) nervous system. One-way ANOVA with multiple comparison analysis was performed. padj value from L to R for (I): padj < 0.0001, padj < 0.0001 and for (J): padj < 0.0001, ns = padj = 0.07. Error bars display the SEM. n = 15–20 animals. Source data are available online for this figure.
Figure 7
Figure 7. Broadly conserved features of MUN-domain gene microexon alternative splicing.
(A) Phylogenetic tree of MUN family members based on Pei et al, (Pei et al, 2009), revealing three clusters: UNC-13 family, UNC-31/CAPS, and UNC-13d (left panel). Presence of alternatively spliced microexon marked as “+” and its absence as “−”. Note that all Group 1 and 2 genes encode microexons in worms, flies and mice. (B) % inclusion for microexons in unc-31 (upper panel) and F54G2.1 (lower panel) in different neuronal subtypes. Both microexons are highly included in motor neurons. Error bars display the SEM. (C) Splicing reporters for unc-31 and F54G2.1 microexons in ventral cord motor neurons. (D) % inclusion values for all detectable microexons in three representative chemosensory neurons and three representative motor neurons. Median spliced-in values (central line) are modestly higher in motor neurons than in olfactory neurons, but MUN-domain microexons (orange dots) are extreme outliers of skipping in olfactory neurons and inclusion in motor neurons (boxes represent 25th and 75th percentiles). The plot displays whiskers at the maxima and minima (0 and 100). (E, F) % inclusion values obtained from RNA seq data (E) and further verified by semi-quantitative RT-PCR (F) for MUN-domain microexons reveal co-regulation by EXC-7 and MBL-1. Numbers below bands indicate PSI values determined by gel densitometry. Error bars display the SEM. (G) ∆PSI values for observed exc-7; mbl-1 double mutants compared to expected ΔPSI values based on additive effects of single mutant exc-7 and mbl-1 ΔPSIs. Thus, negative, and positive values represent microexons that are more skipped or more included, respectively, compared to an additive-effect model. Orange asterisks highlight microexons in MUN-domain family genes. (H) Left panel: aldicarb response curve, right panel: quantification of the fraction of animals moving at 80 min. exc-7; mbl-1 double mutants are aldicarb hypersensitive, and this phenotype is rescued by the addition of an UNC-13included mutation. One-way ANOVA with multiple comparison analysis was performed. padj value from L to R: ns = padj = 0.07, padj < 0.01. Error bars display the SEM. (I) Sashimi plot for alternatively spliced CADPS/unc-31 microexon in mouse motor and olfactory neurons. (J) PSI value for the unc-31/Cadps alternative microexon in the mouse motor and olfactory neurons as calculated from RNA seq data. n = 20 animals. Scale Bar 10 µm. Source data are available online for this figure.
Figure EV1
Figure EV1. The presence of an alternative microexon is conserved across species and its splicing pattern is invariant across multiple isolated independent integrated transgenic lines in C. elegans.
(A) Schematic of the position of the alternatively spliced microexon in the unc-13 transcript across various species. In mice and humans, it’s 6 nt microexon, whereas in C. elegans and Drosophila, it’s 9 nt. Black arrowheads mark the position of the microexon in different species. (B) unc-13 microexon-splicing pattern in various regions of the nervous system of an independently isolated integrated transgenic line. (C) A neuron marked by a white arrowhead expressing both skipped and included versions in the nerve ring neurons of the unc-13 microexon splicing reporter expressing animal. Scale bar 20 µm.
Figure EV2
Figure EV2. Alternative splicing of the unc-13 microexon is affected in a neuron-specific manner in exc-7 animals.
(A) A region of the head neurons, where an identified neuron in wild type exclusively has RFP, whereas in exc-7(rh252) it has both, GFP and RFP signal. The white arrowhead marks that neuron. Scale bar 10 µm.
Figure EV3
Figure EV3. Mutating cis motifs for EXC-7 and/or MBL-1 affect splicing in a neuronal-subtype-specific manner.
(A) A neuron in pharyngeal region shows the expression of GFP and RFP, whereas in wild type it expresses only included form. The white arrowhead marks that individual neuron. (B) Representative image showing cis motif mutation in both EXC-7 and MBL-1, where a set of animals (~20% of animals) has lesser RFP neuronal cell bodies in head and tail neurons compared to wild type. Scale bar 20 µm.
Figure EV4
Figure EV4. Genetic interaction between splicing regulators for the alternative splicing of unc-13 microexon in different neuronal subtypes (also see Fig. 3G, H in the main section for quantification).
(A) Upper panel: Worm schematic showing the splicing reporter pattern and the below images are from the area marked by dotted rectangle in the ventral cord region. Note that the wild-type control panel is the same worm as in Figs. 2D and 1F. Bottom panel: Representative images of the ventral cord region of the for various genotypes. White arrowheads mark the GFP appearance in the double heterozygous animals. (B) Upper panel: A worm schematic showing splicing reporter with the area marked by a dotted rectangle in the tail region is represented in the below mentioned images for various genotypes. Bottom panel: Representative images of the tail neurons in the mentioned genotypes. White arrowheads in the wild type panel marks a set of tail neurons expressing the skipped isoform (GFP) (C) Quantification of the splicing analysis of the tail neurons in the indicated genotypes. n = 15–20 animals. Scale bar 10 µm.
Figure EV5
Figure EV5. Localization of SNB-1::GFP in dorsal cords and expression analysis of RBPs EXC-7 and MBL-1 by using reporter strains in addition to the CeNGEN database.
(A) Representative images of localization of post-synaptic markers such as acetylcholine receptors (left panel) and GABA receptors (right panel) in the muscle compartment. (B) The upper panel shows GABA motor neurons (white arrowhead) in the ventral cord, which colocalize with MBL-1::RFP driven by a fosmid. (C) GABA motor neurons in the ventral cord marked by BFP (yellow arrowheads) driven under unc-25 promoter does not colocalize with EXC-7::GFP (marked by white arrowheads) in ventral cord neurons. (D) Sensory neurons marked by GFP driven under osm-6 promoter and MBL-1::RFP expression by the fosmid, indicates many of the sensory neurons does not have detectable MBL-1 expression. (E) The upper panel indicates EXC-7::GFP expression in the head region, and the sensory neurons marked by HIS-11::mcherry driven by osm-6 promoter (middle panel). Sensory neurons have little to no detectable expression of EXC-7 as scored by the reporter analysis. (F) Single- cell RNA seq analysis for exc-7 and mbl-1 transcripts in multiple sensory and motor neurons (GABA and cholinergic neurons). Analysis indicates significant transcript level in motor neurons for mbl-1, whereas a set of sensory neurons lack the same, whereas exc-7 transcripts are lower or undetectable in both sensory and GABA motor neurons, but enriched in cholinergic motor neurons. Scale bar 20 µm.

Similar articles

References

    1. Bandyopadhyay U, Cotney J, Nagy M, Oh S, Leng J, Mahajan M, Mane S, Fenton WA, Noonan JP, Horwich AL (2013) RNA-Seq profiling of spinal cord motor neurons from a presymptomatic SOD1 ALS mouse. PLoS ONE 8:e53575 - PMC - PubMed
    1. Bargmann CI, Hartwieg E, Horvitz HR (1993) Odorant-selective genes and neurons mediate olfaction in C. elegans. Cell 74:515–527 - PubMed
    1. Barrett A, Varol E, Weinreb A, Taylor SR, McWhirter RM, Cros C, Vidal B, Basavaraju M, Poff A, Tipps JA et al (2025) Integrating bulk and single cell RNA-seq refines transcriptomic profiles of individual C. elegans neurons. eLife 14:RP106183
    1. Carvill GL, Mefford HC (2020) Poison exons in neurodevelopment and disease. Curr Opin Genet Dev 65:98–102 - PMC - PubMed
    1. Chen M, Manley JL (2009) Mechanisms of alternative splicing regulation: insights from molecular and genomics approaches. Nat Rev Mol Cell Biol 10:741–754 - PMC - PubMed

MeSH terms

Substances

LinkOut - more resources