. 2025 Jun;56(3):e70030.
doi: 10.1111/jtxs.70030.

Ultrasound Imaging of Artificial Tongues During Compression and Shearing of Food Gels on a Biomimetic Testing Bench

Affiliations

Ultrasound Imaging of Artificial Tongues During Compression and Shearing of Food Gels on a Biomimetic Testing Bench

Miodrag Glumac et al. J Texture Stud. 2025 Jun.

Abstract

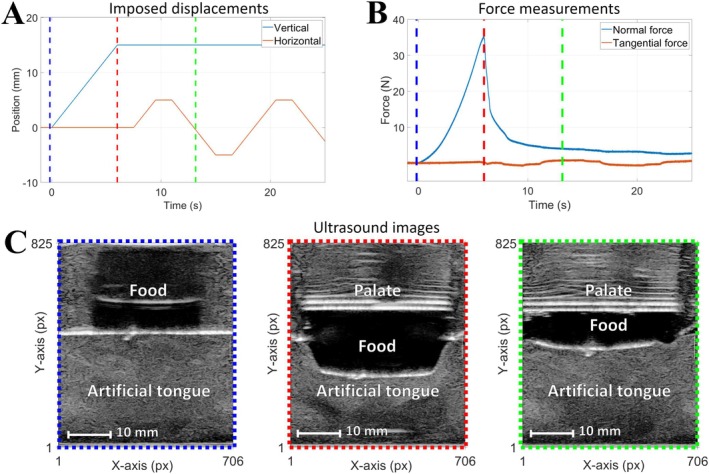
Characterizing the deformations undergone by the tongue during food oral processing could help to better understand how texture sensations are perceived. In this article, we propose to study the potential of ultrasound (US) imaging to monitor the deformations undergone by artificial tongues during compression and shear of agar food gels. Four polyvinyl alcohol cryogels were used as artificial tongues (two levels of roughness and two levels of stiffness), while three agar gels of different concentrations were considered as model foods. Throughout the experiments, US images were acquired from a transducer array positioned underneath the artificial tongue, while force signals were obtained from a multi-axes sensor located above an artificial palate plate. Image analysis first consisted of tracing the contour of the dorsal surface of the artificial tongue. It was thus possible to observe how the deformations are distributed between the artificial tongues and the agar gels and to follow over time the heterogeneity of this distribution along the axis of the transducer array. Then, Particle Image Velocimetry (PIV) analysis was conducted to characterize the velocity fields related to deformations within the artificial tongue. In particular, the horizontal component of the velocity was studied during the shear movements and allowed one to distinguish static and dynamic friction phases, and to highlight the deformation gradients in the bulk of the artificial tongue. Such US method can provide a better understanding of the impact of the mechanical properties of food gels on the stimulation of mechanoreceptors responsible for translating mechanical stimuli into sensory perceptions.

Keywords: artificial tongue; food gels; food oral processing; ultrasound imaging.


Conflict of interest statement

Jean‐Luc Gennisson is a scientific consultant for the company Supersonic Imagine, which built up the ultrasound imaging device used in this study.

Figures

FIGURE 1
FIGURE 1
Picture of the tongue‐palate biomimetic testing bench, with the description of the main components.
FIGURE 2
FIGURE 2
(A) Displacements of the vertical (blue solid line) and horizontal (orange solid line) translation stages as a function of time during a test protocol. (B) Corresponding variations of the normal (blue solid line) and tangential (orange solid line) forces were measured with the multi‐axes force sensor (Artificial tongue: TC/S; Food gel: Ag1.00). (C) US images were acquired at different times during an experiment. The colors of the lines surrounding each US image match with those of the vertical dotted lines in (A) and (B): Before the start of compression (blue), at the end of compression (red), during a shearing motion (green).
FIGURE 3
FIGURE 3
(A) Different steps of image analysis illustrated with an experiment combining an artificial tongue TC/S with a food gel Ag1.00. (B) Isolated region of artificial tongue surface (size of 50 px × 50 px, corresponding to the blue squares in A) during different steps of image analysis. Three vertical lines indicate the locations of the calculations of pixel intensity values represented in (C) for the different steps of image analysis that were applied to the images.
FIGURE 4
FIGURE 4
(A) Illustration of the time window (red dotted line) and of the specific time points (from t 1 to t 4) during which the Particle Image Velocimetry analyses were carried out to assess the fields of horizontal velocity during shear motions. (B) For an experiment conducted on artificial tongue TC/S combined with food gel Ag1.00, an ultrasound image with the representation of the region of interest (ROI), demarcated by red rectangles. (C) Maps of horizontal velocities obtained by PIV at the four time points represented over the entire ROI. (D) Variations over time of the horizontal velocities obtained by PIV, represented over the form of average values along the x‐axis.
FIGURE 5
FIGURE 5
Evolution of the normal force measured as a function of time for the different combinations of artificial tongues and food gels: Experiments on smooth artificial tongues in (A), and rough ones in (B). Corresponding evolutions of the US time‐of‐flight measured at the level of the middle of the US probe: For smooth artificial tongues in (C) and for rough ones in (D). Each color is associated with a type of food gel: Blue for Ag1.00, orange for Ag0.60, and yellow for Ag0.45. The style of the line corresponds to the rigidity of the artificial tongue: Solid line for “compliant” artificial tongues, dashed line for “hard” ones.
FIGURE 6
FIGURE 6
2‐D representations of the evolution of the time‐of‐flight of the echo of the US waves reflected on the top surface of the artificial tongues. Graphs correspond to one out of the three food gels, with the top row (A) being paired with a “compliant” and “smooth” artificial tongue while the bottom row (B) being paired with a “hard” and “smooth” artificial tongue. The horizontal axis represents the lateral position along the width of the US probe. The vertical axis, from 0 to 25.5 s, represents the time elapsed during an experiment. The intensity of time‐of‐flight fluctuations is color coded.
FIGURE 7
FIGURE 7
Temporal evolutions of the horizontal component velocities obtained from PIV analysis during shearing motions between 10 and 22 s. Represented values correspond to an interrogation area located laterally in the middle of the US probe, and in vertical coordinate as close as possible to the top surface of the artificial tongue.

Similar articles

References

    1. Adkins, C. , Takakura W., Spiegel B. M. R., et al. 2020. “Prevalence and Characteristics of Dysphagia Based on a Population‐Based Survey.” Clinical Gastroenterology and Hepatology 18, no. 9: 1970–1979. 10.1016/j.cgh.2019.10.029. - DOI - PMC - PubMed
    1. Akgul, Y. S. , Kambhamettu C., and Stone M.. 1999. “Automatic Extraction and Tracking of the Tongue Contours.” IEEE Transactions on Medical Imaging 18, no. 10: 1035–1045. 10.1109/42.811315. - DOI - PubMed
    1. Al‐hammuri, K. , Gebali F., Thirumarai Chelvan I., and Kanan A.. 2022. “Tongue Contour Tracking and Segmentation in Lingual Ultrasound for Speech Recognition: A Review.” Diagnostics 12, no. 11: 1–26. 10.3390/diagnostics12112811. - DOI - PMC - PubMed
    1. Andablo‐Reyes, E. , Bryant M., Neville A., et al. 2020. “3D Biomimetic Tongue‐Emulating Surfaces for Tribological Applications.” ACS Applied Materials and Interfaces 12, no. 44: 49371–49385. 10.1021/acsami.0c12925. - DOI - PMC - PubMed
    1. Avila‐Sierra, A. , Bugarin‐Castillo Y., Glumac M., et al. 2024. “A First‐Of‐Its‐Kind 3D Biomimetic Artificial Mouth Capable of Reproducing the Oral Processing of Soft Foods.” Scientific Reports 14, no. 1: 22908. 10.1038/s41598-024-73629-9. - DOI - PMC - PubMed

LinkOut - more resources