Simultaneous Repression of GLUCAN WATER DIKINASE 1 and STARCH BRANCHING ENZYME 1 in Potato Tubers Leads to Starch With Increased Amylose and Novel Industrial Properties
- PMID: 40491003
- PMCID: PMC12149484
- DOI: 10.1002/biot.70051
Simultaneous Repression of GLUCAN WATER DIKINASE 1 and STARCH BRANCHING ENZYME 1 in Potato Tubers Leads to Starch With Increased Amylose and Novel Industrial Properties
Abstract
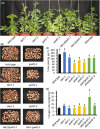
This study examines how post-transcriptional gene silencing of STARCH BRANCHING ENZYME 1 (SBE1) and GLUCAN WATER DIKINASE 1 (GWD1) affects the structure and properties of potato tuber starch. Silencing of either gene individually or simultaneously altered starch chemistry physical properties. Repression of StGWD1 reduced phosphate content, while repression of StSBE1 increased it. The phosphate content of starch isolated from plants where both genes were repressed was increased compared to StGWD1 repressed lines, but lower than both the SBE1 repressed lines and the untransformed control. Constituent chain lengths of starches from all lines were altered, and amylose content was increased in the gwd1 and sbe1/gwd1 double repressed lines, which also accumulated small numbers of lobed starch granules. Pasting properties were also affected, with starch from StSBE1-repressed lines demonstrating increased peak and trough viscosities and gwd1 lines showing decreased peak and trough viscosities, compared with the control. Peak and trough viscosities were lowest in the sbe1/gwd1 repressed lines. We believe that these data demonstrate that alterations in starch phosphate influence the degree of branching within starch and offer a novel in planta strategy for optimizing the industrial properties of potato storage starch.
Keywords: Glucan water dikinase; Starch branching enzyme; Starch structure.
Biotechnology Journal© 2025 The Author(s). Biotechnology Journal published by Wiley-VCH GmbH.
Conflict of interest statement
The authors declare no conflicts of interest.
Figures


References
-
- Zeeman S., Kossmann J., and Smith A., “Starch: Its Metabolism, Evolution, and Biotechnological Modification in Plants,” Annual Review of Plant Biology 61 (2010): 209–234. - PubMed
-
- Tetlow I. J. and Emes M. J., “Starch Biosynthesis in the Developing Endosperms of Grasses and Cereals,” Agronomy 7 (2017): 81.
-
- Blennow A., Engelsen S. B., Munck L., and Møller B. L., “Starch Molecular Structure and Phosphorylation Investigated by a Combined Chromatographic and Chemometric Approach,” Carbohydrate Polymers 41 (2000): 163–174.
-
- Sonnewald U. and Kossmann J., “Starches—From Current Models to Genetic Engineering,” Plant Biotechnology Journal 11 (2013): 223–232. - PubMed
MeSH terms
Substances
Grants and funding
LinkOut - more resources
Full Text Sources

