Review
. 2025 Jul;38(7):e70076.
doi: 10.1002/nbm.70076.

Physiological Confounds in BOLD-fMRI and Their Correction

Affiliations
Review

Physiological Confounds in BOLD-fMRI and Their Correction

Abdoljalil Addeh et al. NMR Biomed. 2025 Jul.

Abstract

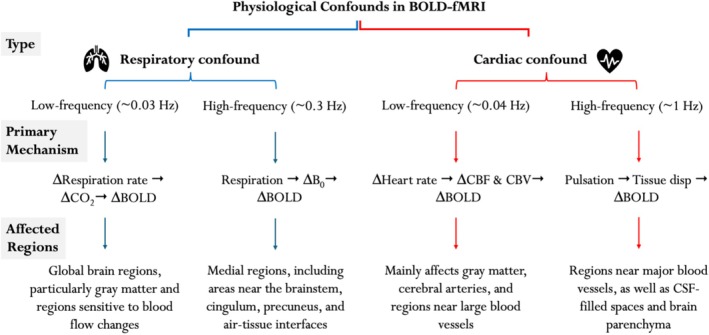
Functional magnetic resonance imaging (fMRI) has opened new frontiers in neuroscience by instrumentally driving our understanding of brain function and development. Despite its substantial successes, fMRI studies persistently encounter obstacles stemming from inherent, unavoidable physiological confounds. The adverse effects of these confounds are especially noticeable with higher magnetic fields, which have been gaining momentum in fMRI experiments. This review focuses on the four major physiological confounds impacting fMRI studies: low-frequency fluctuations in both breathing depth and rate, low-frequency fluctuations in the heart rate, thoracic movements, and cardiac pulsatility. Over the past three decades, numerous correction techniques have emerged to address these challenges. Correction methods have effectively enhanced the detection of task-activated voxels and minimized the occurrence of false positives and false negatives in functional connectivity studies. While confound correction methods have merit, they also have certain limitations. For instance, model-based approaches require externally recorded physiological data that is often unavailable in fMRI studies. Methods reliant on independent component analysis, on the other hand, need prior knowledge about the number of components. Machine learning techniques, although showing potential, are still in the early stages of development and require additional validation. This article reviews the mechanics of physiological confound correction methods, scrutinizes their performance and limitations, and discusses their impact on fMRI studies.

Keywords: BOLD‐fMRI; cardiac confound; data‐driven approaches; external recording; model‐based approaches; respiratory confound.


Figures

FIGURE 1
FIGURE 1
Trends in published articles on the impact of physiological confounds in fMRI research. This figure illustrates the number of publications sourced from Scopus.com, using the search terms “fMRI,” “fMRI physiological confounds,” and “fMRI physiological noise” within the title, abstract, and keywords of the articles. It presents a comparative analysis between the total fMRI studies and those considering physiological confounds. The data reveals a growing but still limited scholarly focus on these confounds, as evidenced by the relatively small proportion of publications considering them compared to the overall number of fMRI studies. This discrepancy highlights a critical gap in current research methodologies, indicating that the majority of fMRI research has not yet systematically considered physiological confounds.
FIGURE 2
FIGURE 2
Illustration of the BOLD‐fMRI signal influenced by various scan and physiological parameters. (a) Shows the dependence of the BOLD response on changes in CBF, modulated by the ratio of fractional CBF to CMRO2 changes, denoted by n, and the baseline dHb scaling factor, represented by M (panel a, left). It also illustrates how initial magnetization (M0) (panel a, middle) and T2* relaxation times (panle a, right) further influence the BOLD signal. (b) Illustrates the general process by which neural activity, whether evoked by an external task (e.g., a stimulus) or arising spontaneously, as in resting‐state fMRI, leads to changes in the BOLD signal. The diagram includes contributions from neuronal activity and confounding factors such as respiratory and cardiac signals, ultimately influencing the BOLD response observed over time. (c) Compares the relative changes in CMRO2, CBF, and BOLD responses between task‐based stimuli and a breath‐holding condition. It highlights that task‐induced BOLD signals involve both CMRO2 and CBF, whereas the breath‐holding BOLD response is driven predominantly by changes in CBF alone, producing a similar BOLD signal through a different physiological pathway.
FIGURE 3
FIGURE 3
Physiological confounds in BOLD‐fMRI. The figure categorizes physiological confounds into respiratory and cardiac domains, outlining their characteristic frequencies, underlying mechanisms, and regional impacts on the BOLD signal. It highlights the necessity for targeted correction strategies to improve the accuracy of fMRI data analysis.
FIGURE 4
FIGURE 4
Example of respiratory signals from different groups in the human connectome project development [75]. (a–c) Signal with removable spikes (HCP‐D‐0425335, Session 1, Run 2; HCD0271031, Session 2, Run 2; HCP‐D‐2000111, Session 2, Run 1). Light gray graphs show the original respiratory signal with removable spikes. (d) Signal with unremovable spikes marked by color dashes (HCP‐D‐2335344, Session 2, Run 2); (e) partially recorded signal (HCP‐D‐0968878, Session 2, Run 2). In this example, spikes are removed from recorded parts of the signal to show the impact of spike elimination clearly; (f) Not recorded (signal with zero amplitude, HCP‐D‐0110411, Session 2, Run 1) and signal varies only in a small range having square pulse‐shape pattern (HCP‐D‐0694564, Session 1, Run 2); (g) very distorted signals with high‐frequency noise (HCP‐D‐0146937, Session 1, Run 1); (h) connections changed at a certain point (HCP‐D‐1796577, Session 1, Run 1). Adapted from Addeh et al. [28].
FIGURE 5
FIGURE 5
Comparative analysis of respiratory measures in fMRI data correction. Panel (a) displays the synchronization of RVT and RV with respiratory depth and rate using HCP‐D dataset. Panel (b) highlights RVT and RV's sensitivity to a deep breath event (green arrow) and a missed deep breath by RVT (blue arrow). Panel (c) demonstrates the disparate responses of RVT and RV to simultaneous changes in breathing rate and depth (orange double arrows). Panel (d) illustrates an 11‐s breath‐holding period's impact on RVT and RV (orange arrow), with RV showing an initial decline followed by stabilization and increase, and RVT's variable response due to adjacent time series values.
FIGURE 6
FIGURE 6
Power spectral density of motion traces for HCP‐D dataset, HCP‐YA dataset, and HCP‐A dataset. In HCP‐D and HCP‐A project, the PE direction is anterior → posterior (AP) and posterior → anterior (PA). In HCP‐YA project, the PE direction is LeftRight (LR) and RightLeft (RL). The respiration creates head pseudomotion at frequency of ~0.3 Hz as shown by red arrow, which consistent with the normal breathing rate of each group. The low‐frequency motion peak, 0.12 Hz, was not evident in cohort of children but was present in all adult cohorts, especially in the aged population as shown by blue arrow.
FIGURE 7
FIGURE 7
Comparison of respiratory signals and motion parameters in fMRI data. The graphs illustrate the raw respiratory signal (black), unfiltered motion parameters in the PE direction (red), and motion parameters post‐notch filter application (blue). Notably, the notch filter, with a cut‐off frequency set at 0.35 Hz and a bandwidth of 0.30 Hz, reduces respiratory‐related motions. However, it does not capture the full spectrum of respiratory rate variability, which includes periods of slower breathing rates dipping below 0.2 Hz.
FIGURE 8
FIGURE 8
Leveraging ML for enhanced physiological confound correction in fMRI. This figure compares measured and reconstructed RV waveforms over the entire scan duration. Panels (a)–(d) demonstrate the effectiveness of machine learning models, specifically CNNs, in reconstructing RV waveforms using BOLD signals alone (red line) and in combination with head motion parameters (blue line). The inclusion of head motion parameters significantly enhances the accuracy of the reconstructed signals, as evidenced by lower mean absolute error (MAE), mean squared error (MSE), and dynamic time warping (DTW) values and higher correlation values throughout the scan, especially in challenging regions marked by green and orange arrows. This example highlights the critical role of ML in improving the fidelity of physiological signal reconstruction, thereby aiding in the correction of physiological confounds in fMRI data. Adapted from Addeh et al. [118].
FIGURE 9
FIGURE 9
Regional Sensitivity to Physiological Fluctuations in fMRI. This figure illustrates the spatial distribution of physiological signal fluctuations affecting the BOLD signal across different brain regions, categorized by frequency and physiological origin. Low‐frequency respiratory‐related fluctuations (yellow) predominantly impact regions adjacent to large venous structures, including the superior sagittal sinus. Low‐frequency cardiac‐related fluctuations (blue) influence cortical and subcortical areas, notably the occipital cortex, posterior cingulate, and parietal lobes. High‐frequency respiratory‐related fluctuations (green) are primarily localized around the brainstem and medial regions such as the cingulum and precuneus, whereas high‐frequency cardiac‐related fluctuations (red) are concentrated near major arterial structures, including the vertebrobasilar system, the middle cerebral artery near the insula and anterior temporal lobes, and the anterior cerebral artery within the interhemispheric fissure. The anatomical slices (axial, coronal, and sagittal) provide a detailed visualization of these spatial patterns, highlighting the vessel‐dependent and region‐specific nature of physiological fluctuations. These maps were generated based on regions reported in the literature, rather than from original analyses. All images are displayed in the standard Montreal Neurological Institute (MNI 152) T1‐weighted 1‐mm brain template.

Similar articles

References

    1. Blockley N., Griffeth V., Simon A., and Buxton R., “Quantitative fMRI,” in fMRI: From Nuclear Spins to Brain Functions (2015): 215–243.
    1. Bai W., Yamashita O., and Yoshimoto J., “Learning Task‐Agnostic and Interpretable Subsequence‐Based Representation of Time Series and Its Applications in fMRI Analysis,” Neural Networks 163 (2023): 327–340, 10.1016/j.neunet.2023.03.038. - DOI - PubMed
    1. Ren P., Bi Q., Pang W., et al., “Stratifying ASD and Characterizing the Functional Connectivity of Subtypes in Resting‐State fMRI,” Behavioural Brain Research 449 (2023): 114458, 10.1016/j.bbr.2023.114458. - DOI - PubMed
    1. Ogawa S., Lee T. M., Kay A. R., and Tank D. W., “Brain Magnetic Resonance Imaging With Contrast Dependent on Blood Oxygenation,” Proceedings of the National Academy of Sciences of the United States of America 87, no. 24 (1990): 9868–9872, 10.1073/pnas.87.24.9868. - DOI - PMC - PubMed
    1. Blockley N. P., Griffeth V. E., Simon A. B., and Buxton R. B., “A Review of Calibrated Blood Oxygenation Level‐Dependent (BOLD) Methods for the Measurement of Task‐Induced Changes in Brain Oxygen Metabolism,” NMR in Biomedicine 26, no. 8 (2013): 987–1003, 10.1002/nbm.2847 22945365. - DOI - PMC - PubMed

LinkOut - more resources