

Machine Learning Reveals the Value of Unconventional T Lymphocytes in Sepsis and Prognosis of Elderly Patients With Severe Lower Respiratory Tract Infections
- PMID: 40491211
- PMCID: PMC12287663
- DOI: 10.1002/jcla.70065
Machine Learning Reveals the Value of Unconventional T Lymphocytes in Sepsis and Prognosis of Elderly Patients With Severe Lower Respiratory Tract Infections
Abstract
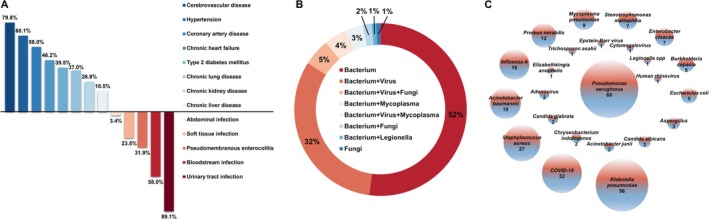
Objective: This study enrolled 119 elderly patients with severe lower respiratory tract infections (LRTIs) and used machine learning (ML) to evaluate the predictive value of unconventional T lymphocytes (uT cells) in sepsis and 90-day prognosis.
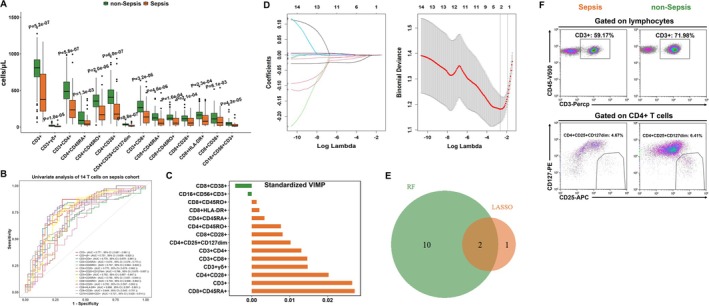
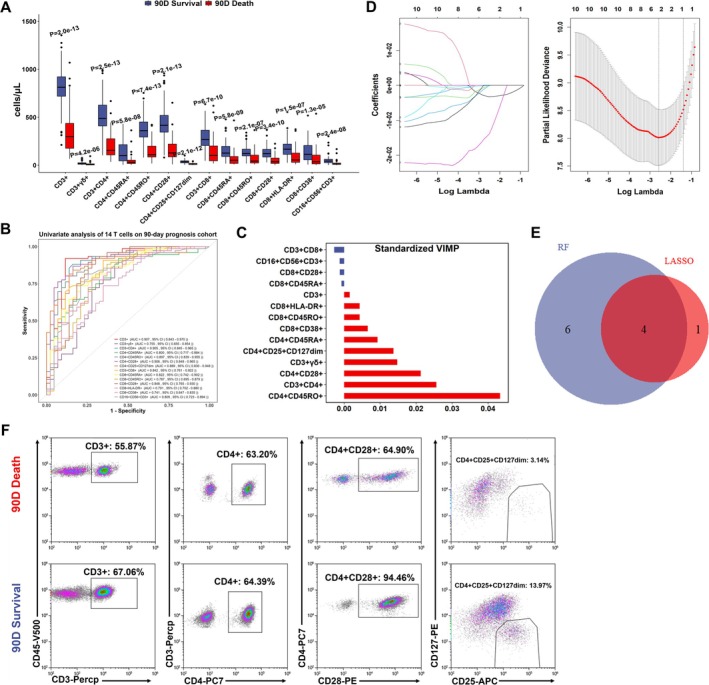
Methods: We used random forest (RF) and LASSO analyses to screen model uT cells (identified by RF-LASSO overlapping). The ML models, including LR, LDA, RandomForest, XGBoost, KNN, QDA, NaiveBayes, and ANN, were developed. These models were evaluated and compared based on accuracy, precision, recall, F1 score, sensitivity, specificity, area under the ROC curve (AUROC), and Brier score.
Results: Two T cells were identified as factors of sepsis diagnosis: CD3+ and CD4+CD25+CD127dim. The LDA model demonstrated superior performance, achieving an accuracy of 0.806, AUROC of 0.771, F1 score of 0.720, and a low Brier score of 0.182. Four T cells were identified for predicting the 90-day prognosis: CD3+, CD3+CD4+, CD4+CD28+, and CD4+CD25+CD127dim. For the 90-day prognosis, the LDA model again performed best, with an accuracy of 0.972, F1 score of 0.952, AUROC of 0.935, and a low Brier score of 0.059.
Conclusions: The LDA model is optimal for both diagnosing sepsis and predicting the 90-day prognosis in elderly patients with severe LRTIs. Key T-cell markers identified for sepsis include CD3+ and CD4+CD25+CD127dim, while the 90-day prognosis model includes CD3+, CD3+CD4+, CD4+CD28+, and CD4+CD25+CD127dim T cells. These markers should be prioritized for clinical testing.
Trial registration: Not applicable.
Keywords: T lymphocytes; lower respiratory tract infections; machine learning; prognosis; sepsis.
© 2025 The Author(s). Journal of Clinical Laboratory Analysis published by Wiley Periodicals LLC.
Conflict of interest statement
The authors declare no conflicts of interest.
Figures


Similar articles
-
Supervised Machine Learning Models for Predicting Sepsis-Associated Liver Injury in Patients With Sepsis: Development and Validation Study Based on a Multicenter Cohort Study.J Med Internet Res. 2025 May 26;27:e66733. doi: 10.2196/66733. J Med Internet Res. 2025. PMID: 40418571 Free PMC article.
-
Comparison of Two Modern Survival Prediction Tools, SORG-MLA and METSSS, in Patients With Symptomatic Long-bone Metastases Who Underwent Local Treatment With Surgery Followed by Radiotherapy and With Radiotherapy Alone.Clin Orthop Relat Res. 2024 Dec 1;482(12):2193-2208. doi: 10.1097/CORR.0000000000003185. Epub 2024 Jul 23. Clin Orthop Relat Res. 2024. PMID: 39051924
-
Are Current Survival Prediction Tools Useful When Treating Subsequent Skeletal-related Events From Bone Metastases?Clin Orthop Relat Res. 2024 Sep 1;482(9):1710-1721. doi: 10.1097/CORR.0000000000003030. Epub 2024 Mar 22. Clin Orthop Relat Res. 2024. PMID: 38517402
-
The Machine Learning Models in Major Cardiovascular Adverse Events Prediction Based on Coronary Computed Tomography Angiography: Systematic Review.J Med Internet Res. 2025 Jun 13;27:e68872. doi: 10.2196/68872. J Med Internet Res. 2025. PMID: 40513092 Free PMC article.
-
Transient elastography for diagnosis of stages of hepatic fibrosis and cirrhosis in people with alcoholic liver disease.Cochrane Database Syst Rev. 2015 Jan 22;1(1):CD010542. doi: 10.1002/14651858.CD010542.pub2. Cochrane Database Syst Rev. 2015. PMID: 25612182 Free PMC article.
References
-
- Rombauts A., Abelenda‐Alonso G., Cuervo G., Gudiol C., and Carratala J., “Role of the Inflammatory Response in Community‐Acquired Pneumonia: Clinical Implications,” Expert Review of Anti‐Infective Therapy 20, no. 10 (2022): 1261–1274. - PubMed
-
- Furman C. D., Leinenbach A., Usher R., Elikkottil J., and Arnold F. W., “Pneumonia in Older Adults,” Current Opinion in Infectious Diseases 34, no. 2 (2021): 135–141. - PubMed
MeSH terms
Grants and funding
LinkOut - more resources
Full Text Sources
Medical
Research Materials
