. 2025 May 26:16:1554773.
doi: 10.3389/fgene.2025.1554773. eCollection 2025.

Uncovering codon usage patterns during murine embryogenesis and tissue-specific developmental diseases

Affiliations

Uncovering codon usage patterns during murine embryogenesis and tissue-specific developmental diseases

Sarah E Fumagalli et al. Front Genet. .

Abstract

Introduction: Mouse models share significant genetic similarities with humans and have expanded our understanding of how embryonic tissue-specific genes influence disease states. By improved analyses of temporal, transcriptional data from these models, we can capture unique tissue codon usage patterns and determine how deviations from these patterns can influence developmental disorders.

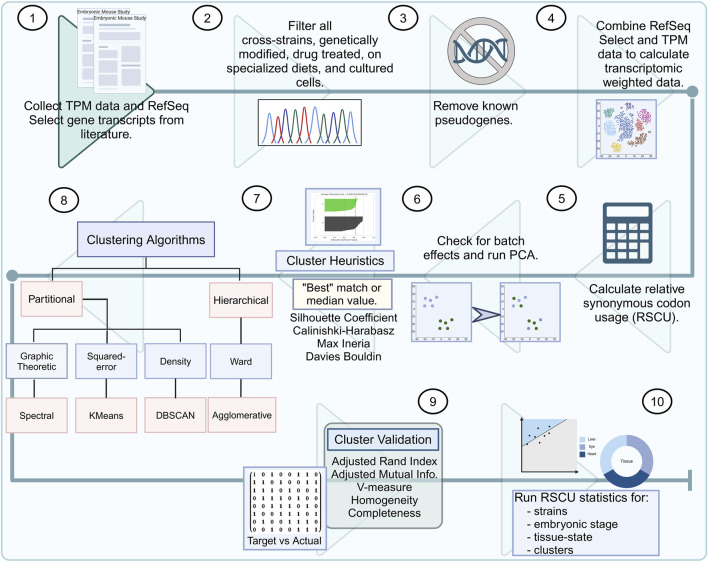
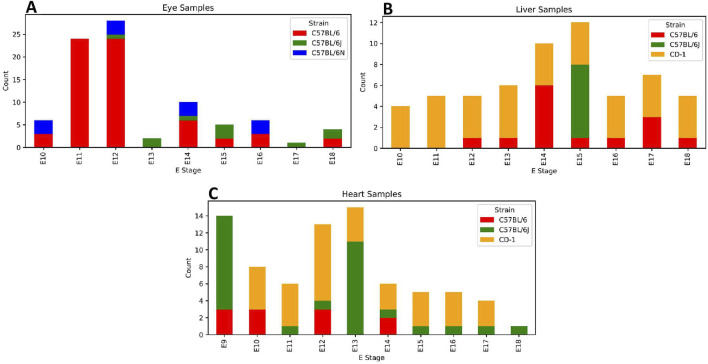
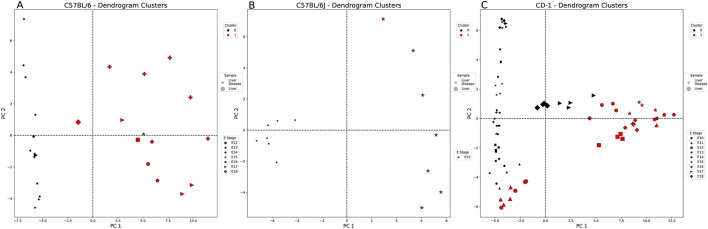
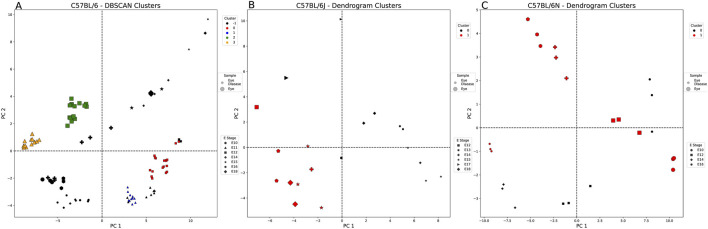
Methods: We analyzed transcriptomic-weighted data from four mouse strains across three different germ layer tissues (liver, heart, and eye) and through embryonic stages. Applying a multifaceted approach, we calculated relative synonymous codon usage, reduced the dimensionality, and employed machine learning clustering techniques.

Results and discussion: These techniques identified relative synonymous codon usage differences/similarities among strains and deviations in codon usage patterns between healthy and disease-linked genes. Original transcriptomic mouse data and RefSeq gene sequences can be found at the associated Mouse Embryo CoCoPUTs (codon and codon pair usage tables) website. Future studies can leverage this resource to uncover further insights into the dynamics of embryonic development and the corresponding codon usage biases that are paramount to understanding disease processes of embryologic origin.

Keywords: clustering methods; disease-associated comparison; machine learning; mouse embryology; relative synonymous codon usage; tissue-specific; transcriptomic-weighted.


Conflict of interest statement

The authors declare that the research was conducted in the absence of any commercial or financial relationships that could be construed as a potential conflict of interest.

Figures

FIGURE 1
FIGURE 1
Murine embryonic data bioinformatics pipeline. (1) Literature research for bulk RNA-seq mouse embryo samples. (2) Quality control by removing cross-strain, genetically modified, drug-treated, or samples from mice on specialized diets. (3) All known pseudogenes should be removed from the transcripts per million (TPM) sample list and RefSeq select genes. (4) TPM counts should be used to weigh the codon usage of the RefSeq select genes. (5) The relative synonymous codon usage (RSCU) for all strains (C57BL/6, C57BL/6J, C57BL/6N, and CD-1) must be calculated across all embryonic stages (ranging from 6 to 18). (6) Batch effects must be checked among the strains, and the RSCU values should be used for all samples to calculate the principal component analysis (PCA). (7) Clustering heuristics must be used for determining the best-estimated number of clusters. (8) Embryonic data must be input through several clustering algorithms: Spectral, KMeans, DBSCAN, and agglomerative. (9) Evaluation metrics must be run for differences in the target groups and resulting clustering. (10) Finally, RSCU statistics must be calculated for strains, embryonic stage, tissue states, and clusters.
FIGURE 2
FIGURE 2
Embryonic stage (E) sample count per strain and tissue type. Each sub-plot contains a corresponding number of stacked bar graphs as E stages that describe the count of each strain for a specified tissue type. Strain colors: red, C57BL/6; green, C57BL/6J; blue, C57BL/6N; and orange, CD-1. Tissue plots: (A) eye, (B) liver, and (C) heart.
FIGURE 3
FIGURE 3
Healthy vs. diseased liver-weighted PCA and clustering example for each embryonic strain. Each figure is labeled with healthy (large markers) and diseased liver samples (small markers). These markers are denoted by the embryonic stage (E) (shape of marker) and the cluster of each sample (cluster 0: black and cluster 1: red). All comparisons are split into two clusters using the agglomerative method. (A) C57BL/6 and (B) C57BL/6J samples split by sample type (tissue state). (C) CD-1 samples are not split by sample type and healthy liver samples from the E17 and E18 groups with the diseased liver samples.
FIGURE 4
FIGURE 4
Healthy vs. diseased eye-weighted PCA and clustering example for each embryonic strain. Each figure is labeled with healthy (large markers) and diseased eye samples (small markers). These markers are also denoted by the embryonic stage (E) (shape of marker) and the cluster of each sample. (A) DBSCAN split the C57BL/6 samples (E10–12, E14–16, and E18) by sample type (tissue state), excluding three of the healthy eye samples from E12 (black: outliers, red: cluster 0, blue: cluster 1, green: cluster 2, and orange: cluster 3). (B) The dendrogram split the C57BL/6J samples (E12–15 and E17–18) by sample type, except for one healthy eye sample from E17 (black: cluster 0 and red: cluster 1). (C) The dendrogram split the C57BL/6N samples (E10, E12, E14, and E16) by sample type, except for the diseased eye samples from E16 (black: cluster 0 and red: cluster 1).
FIGURE 5
FIGURE 5
Healthy vs. diseased heart-weighted PCA and clustering example for each embryonic strain. Each figure is labeled with healthy (large markers) and diseased heart samples (small markers). These markers are also denoted by the embryonic stage (E) (shape of marker) and the cluster of each sample (cluster 0: black, cluster 1: red, cluster 2: blue, and cluster 3: green). All comparisons were split into clusters using the agglomerative method. (A) C57BL/6 samples (E9–10, E12, and E14) split by sample type (tissue state), except for one of the E9 diseased heart samples. (B) C57BL/6J samples (E9 and E11–18) split by sample type, except for two E9 diseased heart samples. (C) CD-1 samples (E10-17) are split by sample type into four clusters.

Similar articles

References

    1. Aguet F., Brown A. A., Castel S. E., Davis J. R., He Y., Jo B., et al. (2017). Genetic effects on gene expression across human tissues. Nature 550 (7675), 204–213. 10.1038/nature24277 - DOI - PMC - PubMed
    1. Aguilera-Castrejon A., Oldak B., Shani T., Ghanem N., Itzkovich C., Slomovich S., et al. (2021). Ex utero mouse embryogenesis from pre-gastrulation to late organogenesis. Nature 593 (7857), 119–124. 10.1038/s41586-021-03416-3 - DOI - PubMed
    1. Alexaki A., Kames J., Holcomb D. D., Athey J., Santana-Quintero L. V., Lam P. V. N., et al. (2019). Codon and codon-pair usage tables (CoCoPUTs): facilitating genetic variation analyses and recombinant gene design. J. Mol. Biol. 431 (13), 2434–2441. 10.1016/j.jmb.2019.04.021 - DOI - PubMed
    1. Allen S. R., Stewart R. K., Rogers M., Ruiz I. J., Cohen E., Laederach A., et al. (2022). Distinct responses to rare codons in select Drosophila tissues. eLife 11, e76893. 10.7554/eLife.76893 - DOI - PMC - PubMed
    1. Asp M., Giacomello S., Larsson L., Wu C., Furth D., Qian X., et al. (2019). A spatiotemporal organ-wide gene expression and cell atlas of the developing human heart. Cell 179 (7), 1647–1660.e19. 10.1016/j.cell.2019.11.025 - DOI - PubMed

LinkOut - more resources