

An integrative and comprehensive analysis of blood transcriptomes combined with machine learning models reveals key signatures for tuberculosis diagnosis and risk stratification
- PMID: 40491837
- PMCID: PMC12146336
- DOI: 10.3389/fmicb.2025.1546770
An integrative and comprehensive analysis of blood transcriptomes combined with machine learning models reveals key signatures for tuberculosis diagnosis and risk stratification
Abstract
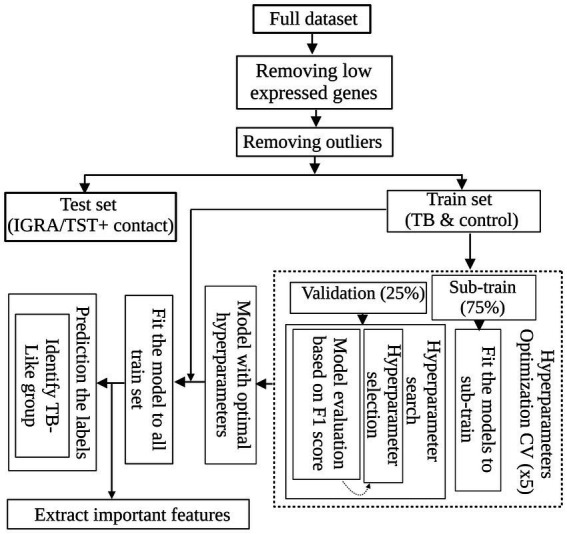
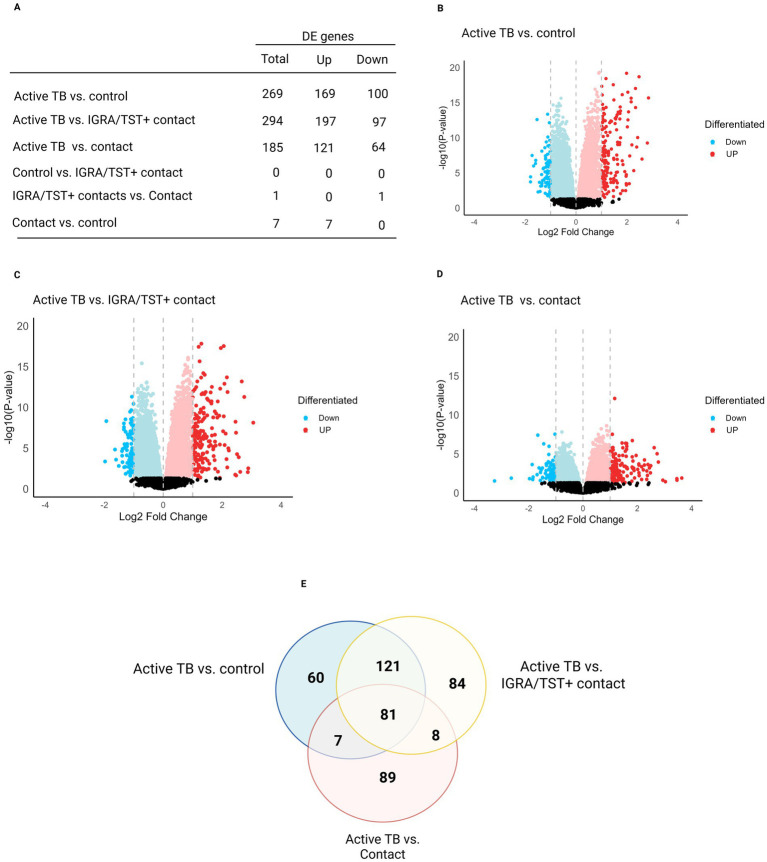
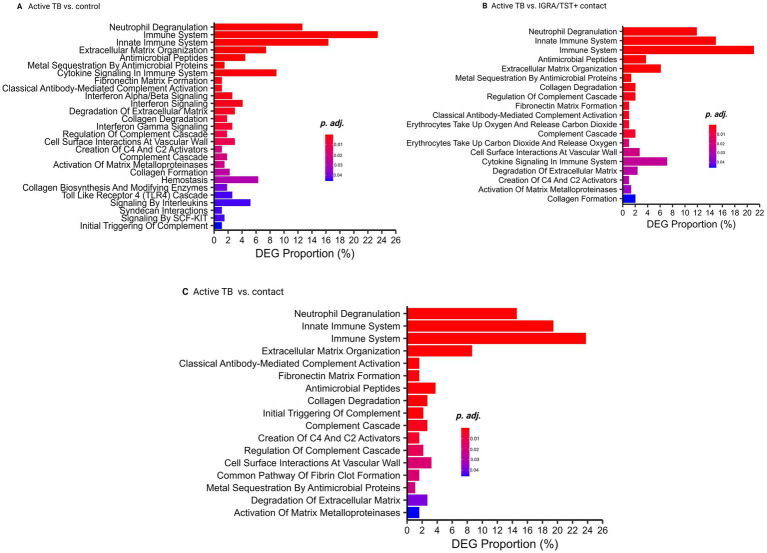
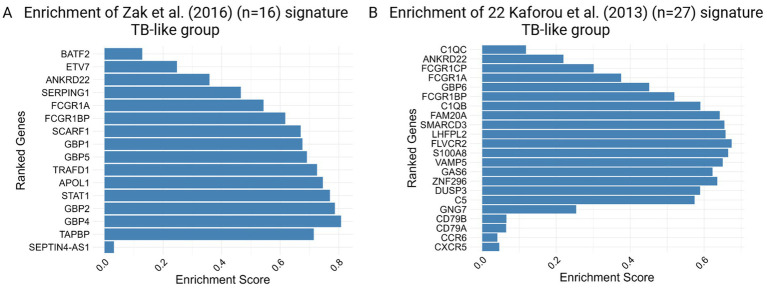
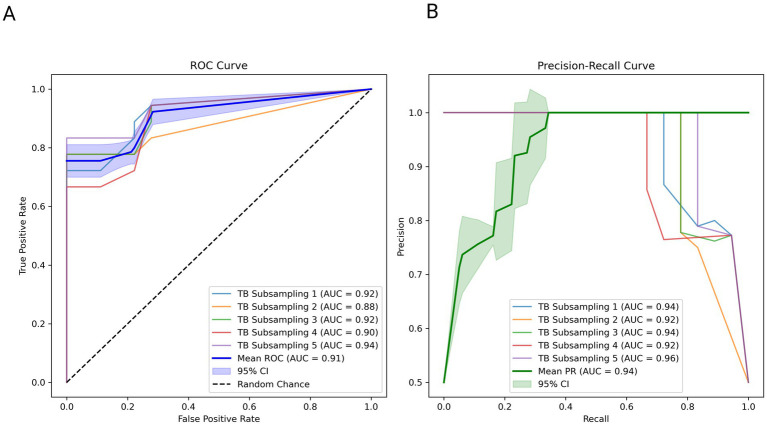
Tuberculosis (TB) remains a major global health challenge, contributing substantially to morbidity and mortality worldwide. The progression from Mycobacterium tuberculosis (Mtb) infection to active disease involves a complex interplay between host immune responses and Mtb's ability to evade them. However, current diagnostic tools, such as interferon-gamma release assays (IGRAs) and tuberculin skin tests (TSTs), have limited ability to distinguish between different stages of TB or to predict the progression from infection to active disease. In this study, we performed an integrative analysis of 324 previously acquired blood transcriptome samples from TB patients, TB contacts, and controls across diverse geographical regions. Differential gene expression analysis revealed distinct transcriptomic signatures in TB patients, highlighting dysregulated pathways related to immune responses, antimicrobial peptides, and extracellular matrix organization. Using machine learning, we identified a 99-transcript signature that accurately distinguished TB patients from controls, demonstrated strong predictive performance across different cohorts, and identified potential progressors or subclinical cases. Validation in an independent dataset comprising 90 TB patients and 20 healthy controls confirmed the robustness of the 10-gene signature (BATF2, FAM20A, FBLN2, AK5, VAMP5, MMP8, KLHDC8B, LINC00402, DEFA3, and GBP6), achieving high area under the curve (AUC) values in both receiver operating characteristic (ROC) and precision-recall analyses. This 10-gene signature offers promising candidates for further validation and the development of diagnostic and prognostic tools, supporting global efforts to improve TB detection and risk stratification.
Keywords: Mycobacterium tuberculosis; RNA-seq; biomarkers; blood; machine-learning.
Copyright © 2025 Omrani, Ghodousi and Cirillo.
Conflict of interest statement
The authors declare that the research was conducted in the absence of any commercial or financial relationships that could be construed as a potential conflict of interest.
Figures
Similar articles
-
[Evolution of IGRA researches].Kekkaku. 2008 Sep;83(9):641-52. Kekkaku. 2008. PMID: 18979999 Review. Japanese.
-
Discovery and validation of a prognostic proteomic signature for tuberculosis progression: A prospective cohort study.PLoS Med. 2019 Apr 16;16(4):e1002781. doi: 10.1371/journal.pmed.1002781. eCollection 2019 Apr. PLoS Med. 2019. PMID: 30990820 Free PMC article.
-
Blood transcriptomic diagnosis of pulmonary and extrapulmonary tuberculosis.JCI Insight. 2016 Oct 6;1(16):e87238. doi: 10.1172/jci.insight.87238. JCI Insight. 2016. PMID: 27734027 Free PMC article.
-
Latent Tuberculosis Infection Diagnosis among Household Contacts in a High Tuberculosis-Burden Area: a Comparison between Transcript Signature and Interferon Gamma Release Assay.Microbiol Spectr. 2022 Apr 27;10(2):e0244521. doi: 10.1128/spectrum.02445-21. Epub 2022 Apr 13. Microbiol Spectr. 2022. PMID: 35416716 Free PMC article.
-
Host-response-based gene signatures for tuberculosis diagnosis: A systematic comparison of 16 signatures.PLoS Med. 2019 Apr 23;16(4):e1002786. doi: 10.1371/journal.pmed.1002786. eCollection 2019 Apr. PLoS Med. 2019. PMID: 31013272 Free PMC article.
References
-
- Abascal E., Pérez-Lago L., Martínez-Lirola M., Chiner-Oms Á., Herranz M., Chaoui I., et al. . (2019). Whole genome sequencing-based analysis of tuberculosis (TB) in migrants: rapid tools for cross-border surveillance and to distinguish between recent transmission in the host country and new importations. Euro Surveill. 24:1800005. doi: 10.2807/1560-7917.ES.2019.24.4.1800005 - DOI - PMC - PubMed
LinkOut - more resources
Full Text Sources
Miscellaneous