. 2025 May 21:18:103-119.
doi: 10.2147/CEG.S504459. eCollection 2025.

Microbial Patterns in Newly Diagnosed Inflammatory Bowel Disease Revealed by Presence and Transcriptional Activity - Relationship to Diagnosis and Outcome

Affiliations

Microbial Patterns in Newly Diagnosed Inflammatory Bowel Disease Revealed by Presence and Transcriptional Activity - Relationship to Diagnosis and Outcome

Simen Svendsen Vatn et al. Clin Exp Gastroenterol. .

Abstract

Background: As part of the IBD Character initiative, we examined an inception cohort and investigated mucosal microbiota composition and transcriptional activity in relation to clinical outcomes.

Methods: A cohort of 237 individuals were included from five countries: Crohn's disease (CD, n = 72), ulcerative colitis (UC, n = 57), symptomatic non-IBD controls (SC, n = 78) and healthy controls (HC, n = 30). Rectal/colonic biopsies were obtained at inclusion, and DNA and RNA were extracted from the same biopsy and examined by sequencing the 16S rRNA V4 region.

Results: Beta diversity measurements separated IBD from both HC and SC. IBD and SC exhibited reduced intra-individual diversity compared with HC. When comparing taxonomy at DNA and RNA level, six bacteria were found to differ in abundance and/or transcriptional activity between IBD and symptomatic control, while there were 14 and three between symptomatic control and CD and UC, respectively. A limited number of bacterial taxa were responsible for the largest difference between presence and activity, separating patients and controls. Multiple bacterial taxa were associated with treatment escalation in both UC and CD. Machine-learning models separated IBD from symptomatic controls and treatment escalators from non-escalators (AUC >0.8). However, the differential effects were mainly driven by clinical biomarkers, such as f-calprotectin, s-albumin, and b-hemoglobin.

Conclusion: Differences between presence and transcriptional activity were found among multiple taxa when assessing 16S rRNA at DNA and RNA level. Symptomatic controls were more similar to the IBD patients compared to HC. The analyses suggest that the mucosal microbiota carries a moderate diagnostic and predictive potential, outcompeted by f-calprotectin.

Keywords: DNA; IBD; RNA; biomarkers; microbiota.


Conflict of interest statement

Dr Daniel Bergemalm reports personal fees from BMS, personal fees from pharmacosmos, personal fees from Janssen, personal fees from Takeda, personal fees from Sandoz, personal fees from Pfizer, personal fees from Sandoz, outside the submitted work. Dr Trond Espen Detlie reports personal fees from AbbVie, personal fees from Ferring, personal fees from Pfizer, personal fees from Pharmacosmos, personal fees from Takeda, personal fees from Tillotts, personal fees from CLS Vifor Pharma, outside the submitted work. Dr Rahul Kalla reports grants from MRC, grants from Crohn’s and Colitis UK, outside the submitted work. Dr Jonas Halfvarson reports personal fees from AbbVie, personal fees from BMS, personal fees from Eli Lilly, personal fees from Alfasigma, personal fees from Aqilion, personal fees from Celltrion, personal fees from Ferring, personal fees from Galapagos, personal fees from Gilead, personal fees from Index Pharma, grants, personal fees from Janssen, personal fees from Medtronic, personal fees from Merck, grants, personal fees from MSD, personal fees from Novartis, personal fees from Pfizer, personal fees from Prometheus Laboratories Inc., personal fees from Sandoz, personal fees from Shire, personal fees from STADA, grants, personal fees from Takeda, personal fees from Thermo Fisher Scientific, personal fees from Tillotts Pharma, outside the submitted work. Prof Dr Johannes Hov reports grants from South-Eastern Norway Regional Health Authority, during the conduct of the study. Dr Petr Ricanek reports grants from EU FP7 grant: IBD-CHARACTER (contract # 2858546), grants from South-Eastern Norway Regional Health Authority (project numbers 2014011, 2018001 and 2020066), during the conduct of the study. The authors declare no conflicts of interest related to this work.

Figures

Figure 1
Figure 1
(A) Beta diversity measurements demonstrated by principal component analyses (pCoA) plots and boxplots. IBD in red. Controls in blue. The upper two plots are based on the DNA dataset and the lower two plots are based on the RNA dataset. Comparison of IBD vs HC to the left and comparison of IBD vs SC to the right.Horizontal Boxplots for PC1 (principal component 1). Vertical Boxplots for PC2. Black line in the box demonstrates the median value. Standard inter-quartile range (IQR) is applied, with 50% of samples within the box. Extended lines from the boxes illustrates dispersion/variation within the group. (B) Alpha-diversity as estimated by the Shannon diversity index in the DNA (left) and RNA dataset (right). The median index values are given per group.
Figure 2
Figure 2
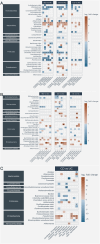
Heatmaps summarizing results from differential abundance analyses using MaAsLin 2 in (A) IBD vs healthy controls, (B) IBD vs symptomatic controls and (C) CD vs UC. Each taxon is grouped according to its phylum. In each heatmap, the two leftmost columns show combined DNA/RNA signatures, while those in the middle represents the DNA dataset, and the rightmost columns show the RNA dataset. “All biopsies” refers to biopsies from both inflamed and non-inflamed tissue, and separate columns for inflamed-only and non-inflamed only are also included. A log2 fold change scale ranges from deep red (more abundant in IBD, CD and UC (A and B), or in CD (C)) to deep blue (less abundant in IBD, CD and UC (A, B), or in CD (C)). All results with nominal p-values < 0.05 are shown, while q-values < 0.05 (FDR-adjusted p-values) are marked with “x”.
Figure 3
Figure 3
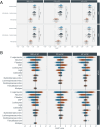
Machine learning results for separating IBD from symptomatic controls, performed with the gpboost in Python 3.6.7 (see Methods). Three different data sets were used as input in the models: microbial data, biochemical markers (Hbg, leukocytes, platelets, albumin, ALP, CRP and f-calprotectin), or a combination of the two. (A) Model performance was estimated with area under the receiver operating curve (AUC), and compared between model categories using t-tests. * = p<0.05. ** = p<0.01. **** = p<0.0001. (B) The impacts of individual variables were assessed using SHapley Additive exPlanations-values (SHAP-values), calculated with the shap package in Python, and the top 10 variables per classification task was visualized.
Figure 4
Figure 4
Heatmaps showing results from differential abundance analyses using MaAsLin 2 directly comparing RNA and DNA-derived abundances in IBD and controls (symptomatic and healthy combined). Each taxon is grouped according to its phylum. Only the categories “All biopsies” or noninflamed-only biopsies are shown. A log2 fold change scale ranges from deep red (more abundant RNA/active microbiota) to deep blue (more abundant in DNA/present microbiota). All results with nominal p-values < 0.05 are shown, while q-values < 0.05 (FDR-adjusted p-values) are marked with “x”.
Figure 5
Figure 5
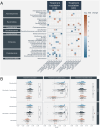
(A) Heatmaps summarizing results from differential abundance analyses of treatment escalation in CD and UC using MaAsLin 2. Each taxon is grouped according to its phylum. In each heatmap, the two leftmost columns show combined DNA/RNA signatures, while those in the middle represents the DNA dataset, and the rightmost columns show the RNA dataset. “All biopsies” refers to biopsies from both inflamed and non-inflamed tissue, and separate columns for inflamed-only and non-inflamed only are also included. A log2 fold change scale ranges from deep red (more abundant in treatment escalators) to deep blue (less abundant in treatment escalators). All results with nominal p-values < 0.05 are shown, while q-values < 0.05 (FDR-adjusted p-values) are marked with “x”. (B) Machine learning results for separating treatment escalators from non-escalators, performed with the gpboost in Python 3.6.7 (see Methods). DNA dataset is applied in the upper comparison and the RNA dataset is applied in the lower comparison. IBD to the left, CD in the middle and UC to the right. Three different data sets were used as input in the models: microbial data, biochemical markers (Hbg, leukocytes, platelets, albumin, ALP, CRP and calprotectin), or a combination of the two. Model performance was estimated with area under the receiver operating curve (AUC), and compared between model categories using t-tests. * = p<0.05*** = p<0.001. **** = p<0.0001.

References

    1. Stange EF, Schroeder BO. Microbiota and mucosal defense in IBD: an update. Expert Rev Gastroenterol Hepatol. 2019;13(10):963–976. doi: 10.1080/17474124.2019.1671822 - DOI - PubMed
    1. Imhann F, Vich Vila A, Bonder MJ, et al. Interplay of host genetics and gut microbiota underlying the onset and clinical presentation of inflammatory bowel disease. Gut. 2018;67(1):108. doi: 10.1136/gutjnl-2016-312135 - DOI - PMC - PubMed
    1. Hold GL, Smith M, Grange C, et al. Role of the gut microbiota in inflammatory bowel disease pathogenesis: what have we learnt in the past 10 years? World J Gastroenterol. 2014;20(5):1192–1210. doi: 10.3748/wjg.v20.i5.1192 - DOI - PMC - PubMed
    1. Gevers D, Kugathasan S, Denson L, et al. The treatment-naive microbiome in new-onset Crohn’s disease. Cell Host Microbe. 2014;15(3):382–392. doi: 10.1016/j.chom.2014.02.005 - DOI - PMC - PubMed
    1. Morgan XC, Tickle TL, Sokol H, et al. Dysfunction of the intestinal microbiome in inflammatory bowel disease and treatment. Genome Biol. 2012;13(9):R79. doi: 10.1186/gb-2012-13-9-r79 - DOI - PMC - PubMed

LinkOut - more resources