[Preprint]. 2025 May 29:2025.05.25.25326586.
doi: 10.1101/2025.05.25.25326586.

Convergent large-scale network and local vulnerabilities underlie brain atrophy across Parkinson's disease stages: a worldwide ENIGMA study

Affiliations

Convergent large-scale network and local vulnerabilities underlie brain atrophy across Parkinson's disease stages: a worldwide ENIGMA study

Andrew Vo et al. medRxiv. .

Abstract

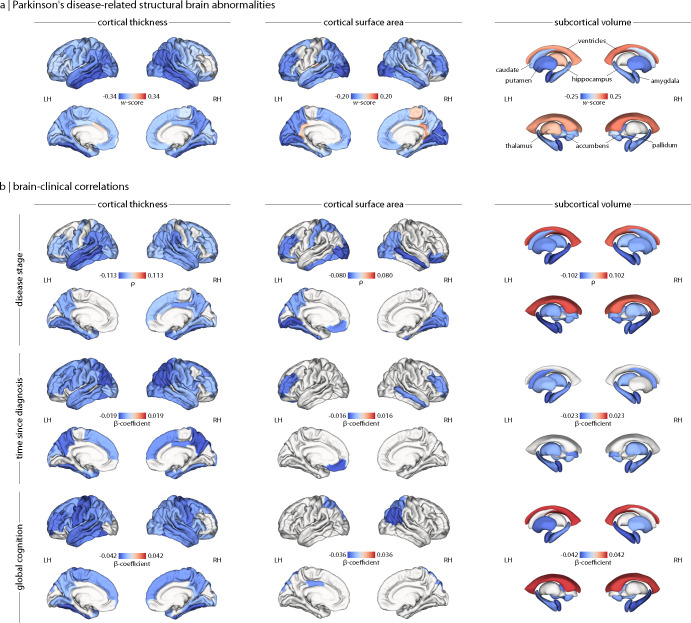
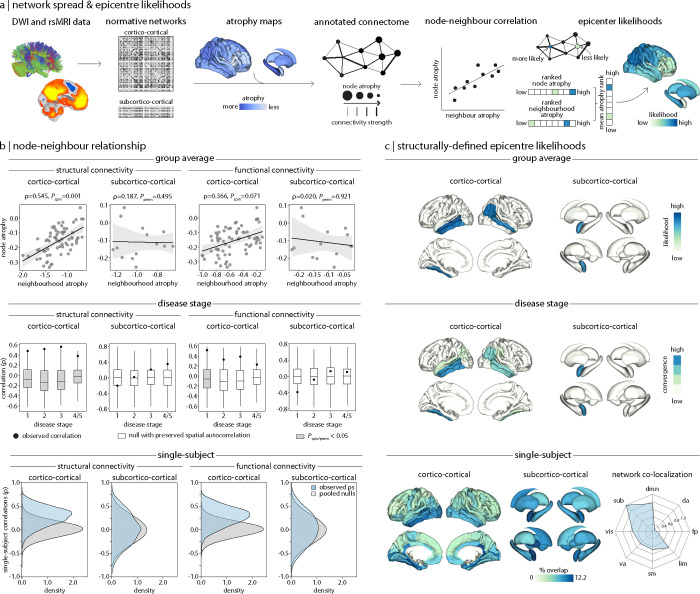
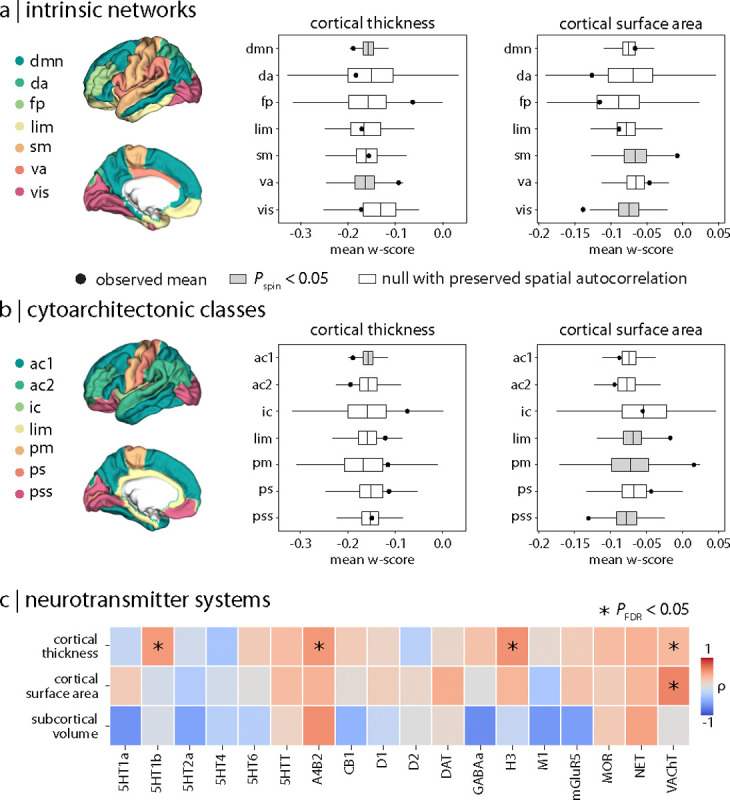
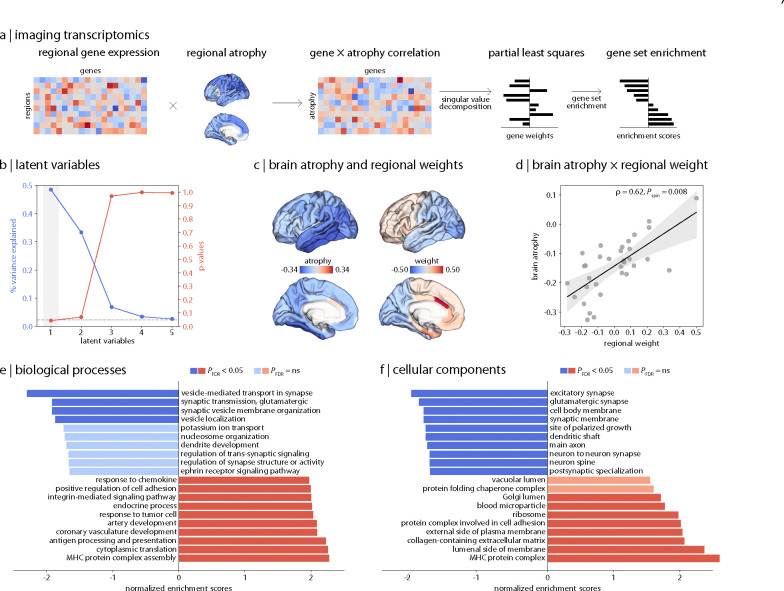
Parkinson's disease (PD) is associated with extensive structural brain changes. Recent work has proposed that the spatial pattern of disease pathology is shaped by both network spread and local vulnerability. However, only few studies assessed these biological frameworks in large patient samples across disease stages. Analyzing the largest imaging cohort in PD to date (N = 3,096 patients), we investigated the roles of network architecture and local brain features by relating regional abnormality maps to normative profiles of connectivity, intrinsic networks, cytoarchitectonics, neurotransmitter receptor densities, and gene expression. We found widespread cortical and subcortical atrophy in PD to be associated with advancing disease stage, longer time since diagnosis, and poorer global cognition. Structural brain connectivity best explained cortical atrophy patterns in PD and across disease stages. These patterns were robust among individual patients. The precuneus, lateral temporal cortex, and amygdala were identified as likely network-based epicentres, with high convergence across disease stages. Individual epicentres varied significantly among patients, yet they consistently localized to the default mode and limbic networks. Furthermore, we showed that regional overexpression of genes implicated in synaptic structure and signalling conferred increased susceptibility to brain atrophy in PD. In summary, this study demonstrates in a well-powered sample that structural brain abnormalities in PD across disease stages and within individual patients are influenced by both network spread and local vulnerability.

Keywords: Parkinson’s disease; connectivity; imaging transcriptomics; neurodegeneration; structural MRI.


Conflict of interest statement

Competing Interests M.H. currently receives payment for Advisory Board attendance/consultancy from Helicon, NeuHealth Digital, and Manus Neurodynamica. Her previous consultancies include: Lundbeck, ESCAPE Bio, Evidera, Biogen MA, CuraSen Therapeutics, Roche Products Ltd, Jazz Pharma, Aventis Pharma. K.L.P. has been on the Scientific Advisory Board for Amprion, and consults for Novartis, Lilly, BioArctic, Biohaven, Curasen and Neuron23. All other authors declare no competing interests related to this article.

Figures

Figure 1:
Figure 1:. Structural brain abnormalities in PD and their clinical correlates.
(a) W-score maps of cortical thickness, cortical surface area, and subcortical volume deviations reveal a widespread pattern of atrophy in PD. More negative w-scores (or bluer regions) represent lower estimates or greater atrophy in PD patients relative to what would be expected in the healthy reference group. (b) Partial rho (ρ) and β-coefficient maps of brain-clinical correlations between cortical thickness, cortical surface area, and subcortical volume deviations and Hoehn and Yahr disease stage, time since diagnosis (in years), and global cognition (Montreal Cognitive Assessment scores), controlling for age and sex effects. Overall, more negative deviations in brain measures were related to advancing disease stage, longer disease durations, and poorer cognition. For display purposes, only regions surviving FDR correction for multiple comparisons (PFDR < 0.05) are shown. LH = left hemisphere; RH = right hemisphere.
Figure 2:
Figure 2:. Network architecture shapes the pattern of atrophy in PD.
(a) Schematic of network-based disease exposure and epicentre likelihood workflows. Structural and functional connectivity was defined by cortico-cortical and subcortico-cortical normative network models derived from an unrelated cohort of healthy participants. This information was used to relate regional abnormality (or “node atrophy”) to the average abnormality across connected neighbour regions (or “neighbourhood atrophy”). The mean rank of node and neighbourhood atrophy was used to identify regions as likely epicentres. (b) Node-neighbourhood atrophy correlations revealed that atrophy patterns were best explained by cortico-cortical structural network models (top row), across disease stages (middle row), and in a large proportion of individual patients (bottom row), followed by cortico-cortical functional network models. Neither subcortico-cortical structural or functional network models explained node-neighbourhood coupling, however. (c) Epicentre likelihoods identified the precuneus, lateral temporal cortex, and amygdala as network-based epicentres (top row), which were consistently identified across disease stages (middle row). Although single-subject epicentres did not frequently generalize across individual patients (bottom row), they were found to co-localize to common networks (dmn: default mode, da: dorsal attention, fp: frontoparietal, lim: limbic, sm: sensorimotor, va: ventral attention; vis: visual). For all brain visualizations, only regions surviving spatial null testing (Pspin/perm < 0.05) are displayed.
Figure 3:
Figure 3:. Distribution of PD-related atrophy in specific brain systems.
Cortical thickness (left) and cortical surface area (right) abnormalities in PD are localized within (a) intrinsic resting networks [30] (dmn: default mode, da: dorsal attention, fp: frontoparietal, lim: limbic, sm: sensorimotor, va: ventral attention; vis: visual) and (b) cytoarchitectonic tissue classes [31, 32] (ac1/2: association 1/2, ic: insular; lim: limbic, pm: primary motor, ps: primary sensory; pss: primary/secondary sensory). (c) Correlations between regional brain atrophy and expression of 18 neurotransmitter systems [33]: acetylcholine (α4β2, M1, VAChT), cannabinoid (CB1), dopamine (D1, D2, DAT), GABA (GABAA/BZ, histamine (H3), glutamate (mGluR5, NMDA), norepinephrine (NET), opioid (MOR), and serotonin (5-HT1A, 5-HT1B, 5-HT2A, 5-HT4, 5-HT6, 5-HTT). * indicates correlations that survived both spatial null testing (Pspin/perm < 0.05) and FDR correction for multiple comparisons (PFDR < 0.05).
Figure 4:
Figure 4:. Relationship between cortical atrophy in PD and gene expression.
(a) Schematic of the imaging transcriptomics workflow. (b) PLS analysis identified a single latent variable (PLS1) that significantly explained 48.53% of the covariance between cortical thickness deviations and gene expression profiles. (c) Regional weights were (d) negatively correlated with regional brain atrophy, indicating that more positive weights were associated with greater cortical atrophy. Gene set enrichment analysis revealed that genes most correlated with cortical atrophy are enriched for (e) synaptic regulation and signalling and (f) synapse and neuron components.

Similar articles

References

    1. Laansma Max A., Bright Joanna K., Al-Bachari Sarah, Anderson Tim J., Ard Tyler, Assogna Francesca, Baquero Katherine A., Berendse Henk W., Blair Jamie, Cendes Fernando, Dalrymple-Alford John C., Bie Rob M.A., Debove Ines, Dirkx Michiel F., Druzgal Jason, Emsley Hedley C.A., Garraux Gäetan, Guimarães Rachel P., Gutman Boris A., Helmich Rick C., Klein Johannes C., Mackay Clare E., McMillan Corey T., Melzer Tracy R., Parkes Laura M., Piras Fabrizio, Pitcher Toni L., Poston Kathleen L., Rango Mario, Ribeiro Letícia F., Rocha Cristiane S., Rummel Christian, Santos Lucas S.R., Schmidt Reinhold, Schwingenschuh Petra, Spalletta Gianfranco, Squarcina Letizia, Heuvel Odile A., Vriend Chris, Wang Jiun-Jie, Weintraub Daniel, Wiest Roland, Yasuda Clarissa L., Jahanshad Neda, Thompson Paul M., Werf Ysbrand D., and The ENIGMA-Parkinson’s Study. International multicenter analysis of brain structure across clinical stages of parkinson’s disease. Movement Disorders, 36(11):2583–2594, January 2021. - PMC - PubMed
    1. Mak Elijah, Su Li, Williams Guy B., Firbank Michael J., Lawson Rachael A., Yarnall Alison J., Duncan Gordon W., Owen Adrian M., Khoo Tien K., Brooks David J., Rowe James B., Barker Roger A., Burn David J., and O’Brien John T.. Baseline and longitudinal grey matter changes in newly diagnosed parkinson’s disease: ICICLE-PD study. Brain, 138(10):2974–2986, 2015. - PMC - PubMed
    1. Zeighami Yashar, Ulla Miguel, Yasser Iturria-Medina, Dadar Mahsa, Zhang Yu, Larcher Kevin Michel-Herve, Fonov Vladimir, Evans Alan C, Collins D Louis, and Alain Dagher. Network structure of brain atrophy in de novo parkinson’s disease. eLife, 4:e08440, September 2015. - PMC - PubMed
    1. Braak Heiko, Tredici Kelly Del, Rüb Udo, de Vos Rob A.I, Jansen Steur Ernst N.H, and Braak Eva. Staging of brain pathology related to sporadic parkinson’s disease. Neurobiology of Aging, 24(2):197–211, 2003. - PubMed
    1. Braak Heiko, Udo Rüb, and Tredici Kelly Del. Cognitive decline correlates with neuropathological stage in parkinson’s disease. Journal of the Neurological Sciences, 248(1–2):255–258, October 2006. - PubMed

Publication types

LinkOut - more resources