[Preprint]. 2025 May 28:2025.05.27.25328314.
doi: 10.1101/2025.05.27.25328314.

β-Amyloid as a new target to suppress tonic PTH hypersecretion in primary hyperparathyroidism

Affiliations

β-Amyloid as a new target to suppress tonic PTH hypersecretion in primary hyperparathyroidism

Chia-Ling Tu et al. medRxiv. .

Abstract

Primary hyperparathyroidism (PHPT) is a common endocrine disorder of aging closely linked to vitamin D deficiency. Reduced vitamin D receptor activities promote parathyroid hormone (PTH) hypersecretion by increasing the heterodimerization of the type B γ-aminobutyric acid receptor 1 (GABAB1R) with the extracellular Ca2+-sensing receptor (CaSR) in parathyroid cells; however, endogenous activators of the heterodimers are unknown. Here we uncovered increased expression of the β-amyloid peptide (Aβ42) cleaved from the amyloid precursor protein in parathyroid cells from PHPT patients and aging mice, and the ability of exogenous Aβ42 to promote tonic PTH secretion from murine or human parathyroid glands ex vivo. Conversely, parathyroid-specific App gene knockout reduced tonic PTH secretion and lowered serum PTH levels in mice. The absence of an Aβ42 effect on PTH secretion in parathyroid glands lacking CaSR or GABAB1R supports direct interactions between Aβ42 and the heterodimer. In situ proteomic profiling of parathyroid glands from PHPT patients closely correlated lower serum 25-hydroxyvitamin D levels with increased GABAB1R /CaSR heterodimer expression, β-amyloidogenesis, and phosphorylation of Tau, a downstream effector of Aβ42. Concurrent ablation of App or the Tau-encoding Mapt gene prevented tonic PTH hypersecretion in parathyroid-specific Vdr-KO mice. Likewise, weekly administration of an Aβ42-neutralizing antibody suppressed tonic PTH hypersecretion and synergized with daily administration of cinacalcet, a calcimimetic that activates CaSR homodimers, to reduce serum PTH levels in aging-induced hyperparathyroidism (HPT) mice. These data demonstrated novel functions of Aβ42 in driving tonic PTH secretion by activating GABAB1R/CaSR heterodimers and suggest the potential for targeting Aβ42 in PHPT treatment.


Conflict of interest statement

Competing interests: JAS is a member of the Data Monitoring Committee of the Medullary Thyroid Cancer Consortium Registry supported by Novo Nordisk, Astra Zeneca and Eli Lilly. Institutional research funding was received from Exelixis and Eli Lilly.

Figures

Fig. 1.
Fig. 1.. Distinct PTH secretory responses in aging and mouse models of HPT.
(A) PTH/Ca2+ concentration-response curves were assessed in PTGs cultured from male C57/B6 mice at 6 (orange triangles) and 24 (purple squares) months of age (MOA) as previously described (10). Rates of PTH secretion (pg/gland/hour) at each [Ca2+]e were plotted to extrapolate the maximal PTH secretion rate (PTHMax) and the Ca2+-setpoint (dotted lines). Mean ± s.e.m., n=8–10 mice per group. (B) Serum PTH (sPTH) and (C) total serum Ca2+ (sCa) of C57/B6 mice at 3 (black circles), 6 (orange triangles), and 24 (purple squares) MOA. Mean ± s.e.m., n=8–17 mice. (D) PTH/Ca2+ dose-response curves of PTGs from PTCVdr−/− (blue triangles), PTCCasr+/− (orange squares), PTCVdr−/−Casr+/− (purple diamonds) mice and control littermates (black circles) at 3 MOA. Mean ± s.e.m., n=5–15 mice per genotype. (E) sPTH and (F) sCa of female PTCVdr−/− (blue triangles), PTCCasr+/− (orange squares), PTCVdr−/−Casr+/− (purple diamonds) mice and control littermates (black circles) at 3 MOA. Mean ± s.e.m., n=10–32 mice. *p<0.05, **p<0.01, ***p<0.005, ****p<0.0001, and no significance (ns) was determined by one-way ANOVA with Fisher’s LSD test.
Fig. 2.
Fig. 2.. Expression of APP and Aβ42 in PTGs and the impact of App gene ablation on PTH secretory responses.
(A) APP and Aβ42 (green) in human PTGs from normal donors (n=7) and in parathyroid adenomas from PHPT patients (n=8), counterstained with wheat germ agglutinin (red) for cell membrane and DAPI (blue) for nuclei. scale bar: 500 μm. (B) Proteomic profiling showed increased expression of APP, Aβ42, β-secretase, and γ-secretase in human parathyroid adenomas versus normal PTGs. Mean ± s.e.m., n=8–12. *p <0.05, ***p<0.005, or ****p<0.0001 (two-tailed student t-test). (C) PTH/Ca2+ dose-response curves of PTGs from PTCApp−/− (pink circles) and Appfl/fl control (blue circles) at 6 MOA. Dotted vertical lines indicate Ca2+-setpoints for the corresponding genotypes. Mean ± s.e.m., of n=9 mice per genotype. (D) sPTH and (E) sCa levels of female PTCApp−/− (pink symbols) and Appfl/fl control (blue symbols) mice at 6 (circle), 12 (triangle), and 18 (square) MOA. (F) Glandular volumes are equivalent between PTCApp−/− (pink circles) and Appfl/fl control (blue circles). Scale bar: 1 mm, mean ± s.e.m. n=11–23 mice per group. ns (p>0.05), *p<0.05, **p<0.01, ****p<0.0001 by one-way ANOVA with Fisher’s LSD test.
Fig. 3.
Fig. 3.. β-Amyloid enhances tonic PTH secretion.
(A) PTGs of PTCApp−/− mice were sequentially incubated with increasing concentrations (from 0. 3 to 1000 nM) of Aβ42 (pink squares), sAPP ExtD domain (sAPP-ExtD, blue triangles), or a reverse ExtD peptide (sAPP-ExtD-rev, black circles) in the presence of 1 mM [Ca2+]e to determine changes in PTH secretion. (B) PTH/Ca2+ dose-response curves of PTGs from PTCApp−/− mice in the presence of 1 μM of Aβ42 (pink squares), a reverse Aβ42 peptide (Aβ42-Rev), or vehicle (Veh, 0.1% DMSO). Aβ42-Rev and vehicle treatments were combined as the control group (black circles). Dotted vertical lines indicate Ca2+-setpoints for the corresponding treatments. (C) PTGs of PTCApp−/− mice were sequentially incubated with increasing doses of Aβ42 with (brown circles) or without (pink squares) CGP54626 (CGP, 10 μM). Mean ± s.e.m., n=4–8 mice per treatment. (D) PTHMax on a per mg of tissue and per hour basis was assessed in normal (NL) human PTGs and parathyroid adenomas from PHPT patients incubated with increasing [Ca2+]e in the presence of Aβ42 peptide (200 nM) with or without CGP54626 (CGP, 20 μM). Mean ± s.e.m. of n=3–4 glands per treatment. ****p<0.001 by two-way ANOVA with Sidak’s test.
Fig. 4.
Fig. 4.. Aβ42 interacts with GABAB1R/CaSR heterodimers and antagonizes Gi activation.
(A) PTGs from PTCApp−/− (pink squares), PTCApp−/−Casr−/− (red triangles), PTCApp−/−Gabbr1−/− (blue diamonds), and PTCApp−/−Casr−/−Gabbr1−/− (purple circles) mice were sequentially incubated with increasing doses (from 0. 3 to 1000 nM) of Aβ42 in the presence of 1 mM of [Ca2+]e. mean ± s.e.m., n=8–11 mice per genotype. (B) Averaged time-course of cAMP levels in the PTH-C1 cells co-expressed CaSR, GABAB1R, and a FRET-based cAMP reporter and were pretreated with cholera toxin. Arrows indicate the times to apply Ca2+ (3 mM), Aβ42 (1 μM), and forskolin/IBMX (10 μM), mean ± s.e.m. of n=3 experiments with 10–15 cells/experiment. (C) Detection of endogenous GABAB1R/CaSR heterodimers by the proximity ligation assay (PLA) and Aβ42 by immunohistochemistry (IHC) and their colocalization in overlayed images of human PTGs from normal donors and parathyroid adenomas from PHPT patients with deficient (<20 ng/ml) or repleted (>30 ng/ml) pre-operative 25OH vitamin D levels (n=4 glands per group). Aβ42 immunoreactivity was visualized with Alex Fluor 488 (green) and GABAB1R/CaSR with Texas Red (red) signals and counterstained with DAPI (blue) for nuclei. Colocalization of Aβ42 and GABAB1R/CaSR heterodimers was indicated by yellow signals in overlayed images. Scale bar: 125 μm.
Fig. 5.
Fig. 5.. Impact of vitamin D deficiency on APP/Aβ signaling responses.
Protein levels of (A) CaSR and GABAB1R, (B) APP and Aβ42, and (C) Tau and its phosphorylation at Serine 404, 396, and 214 were assessed by spatial proteomic profiling of human PTGs of normal donors (norm, n=7, grey circles) and parathyroid adenomas of PHPT patients with vitamin D deficiency (pre-operative 25OHD <20 ng/ml, n=8, pink squares) or replete vitamin D status (25OHD>30 ng/ml, n=15, blue diamonds). Mean ± s.e.m. (D) PTGs of 6-week-old wild-type C57/B6 mice were sequentially incubated with increasing doses (from 0. 3 to 1000 nM) of Aβ42 or a control peptide with reverse sequence (Aβ42-Rev) with or without protein kinase inhibitor K252a (1 μM) in the presence of 1 mM of [Ca2+]e. Changes in the rate of PTH secretion on a per gland and per hour basis were assessed, and the maximal PTH secretion rate (PTHMax) was presented after normalized to the basal rate prior to treatment. Mean ± s.e.m. of n=3 mice per treatment. ns (p>0.05), *p<0.05, **p <0.01, ***p<0.005, and ****p<0.0001 by one-way ANOVA with Fisher’s LSD test.
Fig. 6.
Fig. 6.. Ablation of the parathyroid App gene prevented PTH hypersecretion in mouse models of vitamin D deficiency and chronic Ca2+ deficiency.
(A) PTH/Ca2+ dose-response curves of PTGs from PTCVdr−/− (blue triangles), PTCVdr−/−App−/− (purple diamonds), and control littermates (grey circles) at 6 MOA. Dotted vertical lines indicate the Ca2+-setpoints. mean ± s.e.m., of n=4–7 mice per genotype. (B) sPTH and (C) sCa of female PTCVdr−/− (blue triangles), PTCApp−/− (orange squares), PTCVdr−/−App−/− (purple diamonds) mice, and controls (Vdr+/+App+/+, grey circles) at 12 MOA. mean ± s.e.m., n=6–23 mice per genotype. ns (p>0.05), *p<0.05, **p<0.01, ****p<0.0001 by one-way ANOVA with Fisher’s LSD test. (D) PTH/Ca2+ dose-response curves of PTGs from PTCVdr−/− (blue triangles), Mapt−/− (orange circles), PTCVdr−/−//Mapt−/− (purple diamonds) mice and control littermates (Vdr+/+Mapt+/+, grey circles) at 6 MOA. mean ± s.e.m., of n=6–10 mice per genotype. (E) sPTH and (F) sCa levels of male PTCApp−/− and Appfl/fl control littermates at 12 MOA after feeding with normal (1%) or low calcium (0.02%) diets for 6 weeks. Mean ± s.e.m. of n=6–12 mice for each group, *p<0.05 and **p<0.01 between groups indicated by one-way ANOVA with Sidak’s test.
Fig. 7.
Fig. 7.. Neutralizing Aβ suppresses tonic PTH secretion and reduces serum PTH levels in HPT due to aging.
(A) Changes in PTH secretion rate in PTGs from 24 month-of-old C57/B6 mice incubated with control murine IgG (50 μg/ml, black circles), cinacalcet (Cina, 50 nM, red triangles), or Aducanumab (mAdu, 50 μg/ml, blue triangles) were assessed in the presence of increasing [Ca2+]e. Dotted vertical lines indicate Ca2+-setpoints of the corresponding treatment. mean ± s.e.m., of n=6–15 mice per treatment. (B) sPTH and (C) sCa of male C57/B6 mice after twice-weekly injections of vehicle (brown circles: 3 MOA; black circles: 24 MOA), daily injections of cinacalcet (Cina, 5 mg/kg/day, red triangles), a low dose of aducanumab (Adu, 10 mg/kg/week by once weekly injection, cyan triangles) or a high dose (40 mg/kg/week by twice weekly of 20 mg/kg injections, blue triangles), or a combination of cinacalcet and aducanumab (purple diamonds). mean ± s.e.m., of n=7–15 mice for each treatment. ns (p>0.05), **p<0.01, ***p<0.005, ****p<0.0001 by one-way ANOVA with Fisher’s LSD test.
Fig. 8.
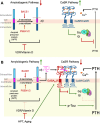
Fig. 8.. A working model for APP/Aβ42 signaling in promoting PTH hypersecretion in HPT secondary to vitamin D deficiency and aging.
(A) Activation of VDR in parathyroid cells by 1,25(OH)2D restricts Aβ42 levels by suppressing the expression of APP and β- and γ-secretase. Activated VDR also increases CaSR expression and enhances the homomeric CaSR-mediated Gq and Gi signaling to limit tonic PTH secretion. (B) In aging and HPT states, VDR and CaSR activities in parathyroid cells decline due to chronic vitamin D deficiency, leading to increased Aβ42 and GABAB1R expression and the formation of GABAB1R/CaSR heterodimer. Activation of GABAB1R/CaSR heterodimers by Aβ42 antagonizes the Gq and Gi signaling and promotes phosphorylation of Tau, driving PTH hypersecretion.

Similar articles

References

    1. Denizot A., Grino M., Oliver C., Surgical management of primary hyperparathyroidism in older adults. J Am Geriatr Soc 62, 1759–1763 (2014). - PubMed
    1. Conroy S., Moulias S., Wassif W. S., Primary hyperparathyroidism in the older person. Age Ageing 32, 571–578 (2003). - PubMed
    1. Yeh M. W., Ituarte P. H., Zhou H. C., Nishimoto S., Liu I. L., Harari A., Haigh P. I., Adams A. L., Incidence and prevalence of primary hyperparathyroidism in a racially mixed population. J Clin Endocrinol Metab 98, 1122–1129 (2013). - PMC - PubMed
    1. Graff-Baker A. N., Bridges L. T., Chen Q., Faries M. B., Said M., Parathyroidectomy for Patients With Primary Hyperparathyroidism and Associations With Hypertension. JAMA Surg 155, 32–39 (2020). - PMC - PubMed
    1. Morris L. F., Zelada J., Wu B., Hahn T. J., Yeh M. W., Parathyroid surgery in the elderly. Oncologist 15, 1273–1284 (2010). - PMC - PubMed

Publication types