[Preprint]. 2025 Mar 24:2025.03.22.644712.
doi: 10.1101/2025.03.22.644712.

A genome-wide in vivo CRISPR screen identifies neuroprotective strategies in the mouse and human retina

Affiliations

A genome-wide in vivo CRISPR screen identifies neuroprotective strategies in the mouse and human retina

Ning Shen et al. bioRxiv. .

Abstract

Retinitis pigmentosa (RP) is a genetically diverse blinding disorder lacking broadly effective therapies. We performed a genome-wide in vivo CRISPR knockout screen in mice carrying the P23H rhodopsin mutation (the most common cause of autosomal dominant RP in the United States) to systematically identify neuroprotective genes. We discovered multiple knockouts that accelerated rod photoreceptor loss, validated top candidates, and showed that overexpressing two genes-UFD1 and UXT-preserved rods and cones, maintained retinal function, and improved visual behaviors. To accelerate translation, we developed a human P23H RP model in adult retinal explants, recreating key disease features. UFD1 and UXT augmentation prevented photoreceptor loss in human P23H retinas. Our findings establish a pipeline for systematic identification and translational testing of neuroprotective genes in mouse and human RP models, provide a novel set of validated candidate genes, and underscore the therapeutic promise of UFD1 and UXT as mutation-agnostic strategies to preserve vision.


Figures
Extended Data Fig. 1 |
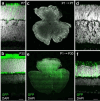
Extended Data Fig. 1 |. Time course of Cas9 and LV expression.
a,b, Representative images of vertical slices from retinas of Nrl-Cas9 mice at P7 (a) and P30 (b) show increasing Cas9 expression visualized via a GFP-tag included in the transgenic allele . Scale bar, 20 μm. c-f, Retinal whole mounts (c,e) and vertical slices (d,f) from mice injected subretinally with LV-EF1α-GFP at P1 and analyzed at P7 (c,d) or P30 (e,f). Scale bar, 500 μm in (c,e) and 20 μm in (d,f).
Extended Data Fig. 2 |
Extended Data Fig. 2 |. CRISPR screen reagent validation and outcome analysis.
a, sgRNA library showed even coverage of sgRNA after expansion as measured by Gini coefficient. b, Coverage statistics of primary screen sequencing data. c–e, Enrichment analyses identifying enrichment of specific cellular pathways enriched in depleted gene set. GSEA (c,d) highlighted two overlapping functional categories while DAVID analysis (e) of genes normZ < −2 identified five largely distinct cellular functions.
Extended Data Fig. 3 |
Extended Data Fig. 3 |. RT-PCR analysis of Cre-dependent gene augmentation.
a,b, Schematics of the AAV constructs and primers designed to detect Cre-dependent overexpression of UFD1 (a) and UXT (b). c,d, Reverse transcription-polymerase chain reaction (RT-PCR) validation of UFD1 (c) and UXT (d) overexpression in AAV-injected P23H Nrl-Cre retinas. P = p-AAV-CAG-Flex-UFD1/UXT plasmid; Un: retinas without AAV injection.
Extended Data Fig. 4 |
Extended Data Fig. 4 |. UFD1 and UXT augmentation improve photoreceptor survival, morphology, and connectivity in the dorsal P23H retina
a, Representative confocal images of dorsal retinal sections from wild-type (WT), untreated P23H, or P23H treated with UFD1 (P23H-UFD1) or UXT (P23H-UXT), stained for rhodopsin (green) and DAPI (white). Scale bar, 20 μm. b, Quantification of rod outer segment (OS) thickness. c, Representative images of dorsal retinal sections from WT, P23H, P23H-UFD1, and P23H-UXT stained for cone arrestin (green) and DAPI (white). Scale bar, 20 μm. d,e, Summary data for cone density (d) and OS thickness (e). f, Representative images of dorsal retinas stained for CtBP2 (green) and DAPI (white), labeling presynaptic ribbons. Scale bar, 10 μm. g, Quantification of CtBP2 immunofluorescence in the outer plexiform layer (OPL). h, Representative images of dorsal retinas stained for mGluR6 (green), PKCα (magenta), and DAPI (white). Scale bar, 10 μm. i, Quantification of mGluR6 puncta at rod bipolar cell dendrites. For (b,d,e,g,i), absence of an asterisk indicates p ≥ 0.05; black asterisks (*p < 0.05, **p < 0.01) indicate significance vs. WT, while gray asterisks (*p < 0.05, **p < 0.001, ***p < 0.001) indicate significance vs. P23H by one-way ANOVA.
Fig. 1 |
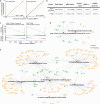
Fig. 1 |. Genome-wide in vivo CRISPR screen in P23H mice.
a,b, Time course of photoreceptor degeneration in P23H mice. (a) Representative vertical sections WT and heterozygous P23H retinas (DAPI stained) at postnatal day 15 (P15) and 1, 2, 3, and 4 months. Scale bar, 20 μm. (b) ONL thickness in P23H retinas normalized to WT littermates at each age. c–g, LV delivery in the mouse retina. (c) Estimates of the distributions of LV multiplicities of infection (i.e., fraction of cells infected by 0, 1, 2, etc. viruses) based on the observed labeling rate (see Methods). (d) Whole-mount image of an LV–EF1α–GFP-infected retina, with regions of highest (e) and lowest (f) transduction. (e1,e2,f1,f2) Enlarged whole-mount (e1,f1) and vertical-section (e2,f2) views of the areas in (e,f). Scale bars, 500 μm (d), 20 μm (e1,e2,f1,f2). (g) Quantification of labeling rates in the regions in high- and low-density regions (n = 3 retinas). h–j, Genome-wide in vivo CRISPR screen logic and outcomes. (h) Schematic of the screen. The Brie library , containing four sgRNAs per gene for the protein-coding mouse genome, was packaged into LVs and delivered subretinally to newborn P23H mice with rod-specific Cas9 expression. After one month, genomic DNA was extracted and sgRNA distributions sequenced. sgRNAs targeting neuroprotective genes become depleted (rod death is accelerated), while those targeting disease-promoting genes become enriched. (i) The comparison between P23H mice with (Cas9(+)) and without (Cas9(−)) rod-specific Cas9 yields normZ scores for each gene (negative = depletion, positive = enrichment). Genes with |normZ| > 2 are color-coded (orange = depleted, green = enriched), with the top 20 annotated. (j) Gene Ontology (GO) and pathway analyses using DAVID (|normZ| > 2) and GSEA (ranked list of all genes), revealing enrichment of pathways related to apoptosis, chromatin regulation, and vacuolar ATPase-mediated lysosomal function. k,l, Expression profiles of the top 20 depleted genes in bulk RNA sequencing data from sorted mouse rods and the rod-rich peripheral human retina (k), and distribution of RNA expression across mouse retinal cell types (l). Data were obtained from SRR3662498, SRR3662513, and SRR3662514 for sorted mouse rods , SRR5591599 for peripheral human retina , and GSE63473 for mouse single-cell data .
Fig. 2 |
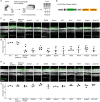
Fig. 2 |. Validating CRISPR screen results and testing for essential genes.
a,b, Schematic of the in vivo electroporation workflow (a) and dual–sgRNA/tdTomato construct (b) used to validate top-ranked CRISPR screen hits in newborn P23H Nrl-Cas9 mice. Retinas were collected at one month. c, Representative confocal images of vertical retinal sections from P23H Nrl-Cas9 mice without electroporation (Ctrl), or electroporated with plasmids encoding non-targeting sgRNAs (Non-targeting) or sgRNAs against ten odd-ranked top hits. tdTomato-positive cells (green) mark transduced photoreceptors; nuclei are stained with DAPI (white). Scale bar, 20 μm. d, Quantification of outer nuclear layer (ONL) nuclei per column from (c). e, As in (c), but in Nrl-Cas9 mice lacking the P23H allele to assess whether these genes are essential in healthy rods. f, Quantification of ONL nuclei per column from (e). Data in (d) and (f) are plotted per retina (dots) with mean ± SEM (lines). One-way ANOVA compares each target to Non-targeting; **p < 0.01, ***p < 0.001, and no asterisk indicates p ≥ 0.05.
Fig. 3 |
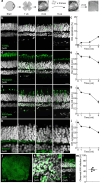
Fig. 3 |. 1 and UXT augmentation improve photoreceptor survival, morphology, and connectivity in P23H mice.
UFD a, Schematics of the AAV constructs (AAV-PHP.eB-Flex) used for rod-specific overexpression of UFD1 or UXT. b, Experimental timeline for testing the effects of UFD1 or UXT overexpression on retinal structure, function, and visual behaviors in P23H knockin mice. c, Representative confocal images of ventral retinal sections from wild-type (WT), untreated P23H, or P23H treated with UFD1 (P23H-UFD1) or UXT (P23H-UXT), stained for rhodopsin (green) and DAPI (white). Scale bar, 20 μm. d, Number of ONL nuclei per column plotted as a function of distance from the optic nerve. Data are mean ± SEM; n = 7–12 retinas from 4–7 mice per group. Gray asterisks indicate significance compared to P23H (*p < 0.05, **p < 0.01) by Monte Carlo permutation testing. e, Quantification of rod outer segment (OS) thickness from (c). f, Representative images of ventral retinal sections from WT, P23H, P23H-UFD1, and P23H-UXT stained for cone arrestin (green) and DAPI (white). Scale bar, 20 μm. g,h, Summary data for cone density (g) and OS thickness (h). i, Representative images of ventral retinas stained for CtBP2 (green) and DAPI (white), labeling presynaptic ribbons. Scale bar, 10 μm. j, Quantification of CtBP2 immunofluorescence in the outer plexiform layer (OPL). k, Representative images stained for mGluR6 (green), PKCα (magenta), and DAPI (white). Scale bar, 10 μm. l, Quantification of mGluR6 puncta at rod bipolar cell dendrites. For (e,g,h,j,l), absence of an asterisk indicates p ≥ 0.05; black asterisks (*p < 0.05, **p < 0.01) indicate significance vs. WT, while gray asterisks (*p < 0.05, **p < 0.001, ***p < 0.001) indicate significance vs. P23H by one-way ANOVA.
Fig. 4 |
Fig. 4 |. UFD1 and UXT augmentation preserve retinal function in P23H mice.
a,f, Representative dark-adapted (scotopic) ERG traces recorded at one month (a) or four months (f) in WT (black), P23H (gray), P23H-UFD1 (orange), and P23H-UXT (green) mice, shown for flash intensities of 9.83 × 10⁻¹ cd·s·m−2. b,c,g,h, Intensity–response curves for a-wave (b,g) and b-wave (c,h) amplitudes under dark-adapted conditions at one and four months, respectively. d,i, Representative light-adapted (photopic) ERG traces at one (d) and four months (i) for flash intensities of 470.28 cd·s·m−2. e,j, Intensity–response curves for the photopic b-wave at 1 (e) and 4 months (j). Data in (b,c,e,g,h,j) are mean ± SEM, with n = 7–15 retinas from 5–9 mice (one-month data) or n = 9–20 retinas from 5–11 mice (four-month data). For all comparisons, black asterisks (*p < 0.05, **p < 0.01) indicate significance vs. WT, while gray asterisks (*p < 0.05, **p < 0.01, ***p < 0.001) indicate significance vs. P23H by Monte Carlo permutation testing. Absence of an asterisk denotes p ≥ 0.05.
Fig. 5 |
Fig. 5 |. UFD1 and UXT augmentation preserve visual behaviors in P23H mice.
a, Schematic of the apparatus used to measure pupillary light responses (PLRs). b, Mean ± SEM pupil area traces from three-month-old WT, P23H, P23H-UFD1, and P23H-UXT mice in response to a light step (gray shading). c,d, Intensity–response curves for the PLR (c) and half-maximal illuminance (EC₅0) values (d). e, Schematic of the visual cliff assay, which assesses depth perception based on a preference for stepping onto a shallow (vs. deep) checkerboard pattern. f, Percentage of shallow-side choices in two–three-month-old WT, P23H, P23H-UFD1, and P23H-UXT mice. In (d) and (f), absence of an asterisk indicates p ≥ 0.05, while gray asterisks (*p < 0.05, **p < 0.01) denote significance compared to P23H by one-way ANOVA.
Fig. 6 |
Fig. 6 |. Human retinal explant cultures.
a, Schematic of the workflow used to establish and maintain adult human retinal explants for up to 5 weeks, with AAV applied at regular intervals. b, Representative confocal images of vertical sections at baseline (Start) and after one, three, or five weeks in culture, stained for TUNEL (green) and DAPI (white). Scale bar, 20 μm. c, Quantification of TUNEL-positive cells in the ONL from (b). d, Representative images stained for rhodopsin (green) and DAPI (white), illustrating rod outer segments over time in culture. Scale bar, 20 μm. e, Rod outer segment thickness from (d), normalized to baseline. f, Representative vertical sections stained for red/green opsin (green) and DAPI (white), highlighting cone outer segments. Scale bar, 20 μm. g, Cone outer segment thickness from (f), normalized to baseline. h, Representative sections stained for Bassoon (green) and DAPI (white), labeling presynaptic structures in the OPL. Scale bar, 20 μm. i, Bassoon intensity from (h), normalized to baseline. In (c,e,g,i), data are mean ± SEM; n = 4 donors. j–l, Representative examples of explants infected with AAV-PHP.eB-CAG-GFP at 1 week, shown in a global whole mount (j), a higher-magnification whole mount (k), and a vertical section (l). Scale bars, 100 μm in (j), 20 μm in (k,l). m, Quantification of AAV infection efficiency in human explants.
Fig. 7 |
Fig. 7 |. UFD1 and UXT augmentation protect photoreceptors in human P23H retinas.
a, Schematic of the AAV constructs used to introduce the P23H rhodopsin transgene (RHO [P23H]-C-MYC plus a siRNA targeting wild-type rhodopsin) and to overexpress UFD1-FLAG or UXT-FLAG in adult human retinal explants. A separate AAV encoding GFP serves as a control. b, Representative confocal images confirming P23H–C-MYC, UFD1–FLAG, and UXT–FLAG expression at one week post-infection. Scale bar, 5 μm. c, TUNEL (green) and DAPI (white) labeling in vertical sections at three weeks for each experimental group: AAV-GFP alone (GFP), GFP + UFD1 (GFP-UFD1), GFP + UXT (GFP-UXT), P23H + GFP (P23H-GFP), P23H + UFD1 (P23H-UFD1), and P23H + UXT (P23H-UXT). Scale bar, 20 μm. d, Quantification of ONL cell counts in (c), normalized to GFP. e, Representative sections stained for rhodopsin (green) and DAPI (white). Scale bar, 20 μm. f, Rod outer segment (OS) thickness from (e), normalized to GFP. g, Representative images stained for red/green (R/G) opsin (green) and DAPI (white). Scale bar, 20 μm. h, Cone OS thickness from (g), normalized to GFP. i, Sections stained for Bassoon (green) and DAPI (white), highlighting OPL synapses. Scale bar, 10 μm. j, Bassoon intensity from (i), normalized to GFP. For (d,f,h,j), absence of an asterisk indicates p ≥ 0.05. Black asterisks (**p < 0.01, ***p < 0.001) denote significance vs. GFP; gray asterisks (*p < 0.05, **p < 0.001, ***p < 0.001) denote significance vs. P23H-GFP by one-way ANOVA.

References

    1. Chaumet-Riffaud A.E., et al. Impact of Retinitis Pigmentosa on Quality of Life, Mental Health, and Employment Among Young Adults. Am J Ophthalmol 177, 169–174 (2017). - PubMed
    1. Sahel J.A., Marazova K. & Audo I. Clinical characteristics and current therapies for inherited retinal degenerations. Cold Spring Harb Perspect Med 5, a017111 (2014). - PMC - PubMed
    1. Daiger S.P., Sullivan L.S., Bowne S.J. & Rossiter B.J.F. RetNet: retinal information network. (2022).
    1. Athanasiou D., et al. The molecular and cellular basis of rhodopsin retinitis pigmentosa reveals potential strategies for therapy. Prog Retin Eye Res 62, 1–23 (2018). - PMC - PubMed
    1. Carss K.J., et al. Comprehensive Rare Variant Analysis via Whole-Genome Sequencing to Determine the Molecular Pathology of Inherited Retinal Disease. Am J Hum Genet 100, 75–90 (2017). - PMC - PubMed

Publication types

LinkOut - more resources