

Sustained excess all-cause mortality post COVID-19 in 21 countries: an ecological investigation
- PMID: 40492564
- PMCID: PMC12150023
- DOI: 10.1093/ije/dyaf075
Sustained excess all-cause mortality post COVID-19 in 21 countries: an ecological investigation
Abstract
Background: Despite widespread vaccination efforts, significant excess mortality continued in various countries following the COVID-19 pandemic. This study aims to estimate excess mortality during 2022 in 21 countries and regions, and to examine the relationship of governmental control measures and vaccination rates with excess mortality during 2021-2 at an ecological level.
Methods: Excess mortality for 2022 was estimated by analysing weekly mortality data from January 2020 to December 2022 across 21 countries and regions participating in the C-MOR consortium. This was achieved by comparing the observed age-standardized mortality rates per 100 000 population to a baseline derived from historical data (2015-19). Governmental control measures and vaccination efforts were investigated for their association with weekly excess mortality during 2021-2 in multilevel models with country as a random effect.
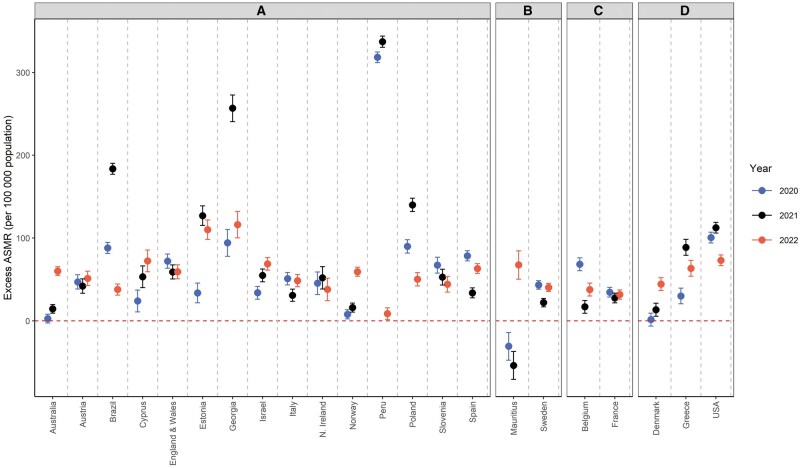
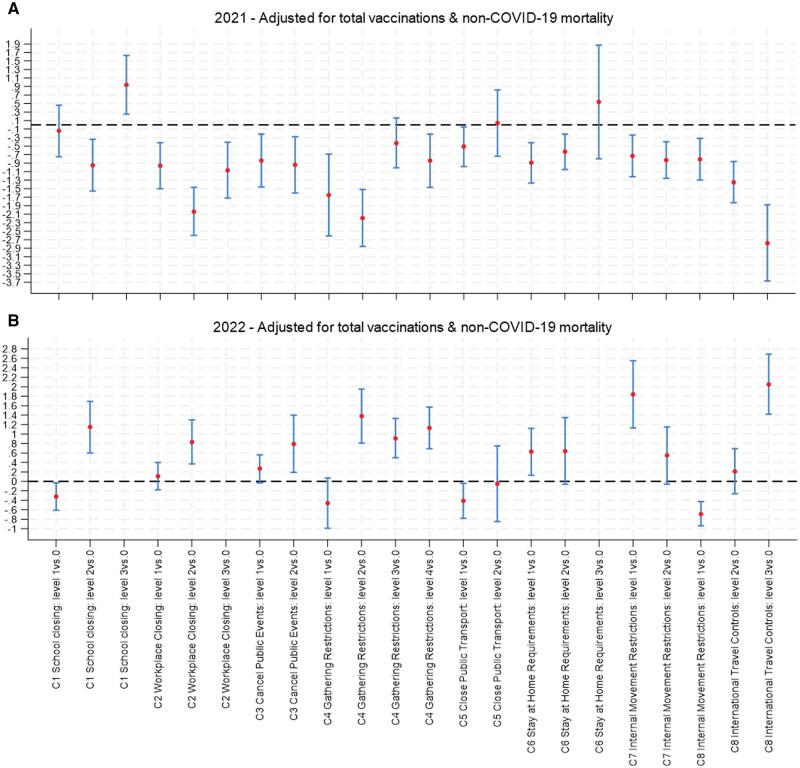
Results: All 21 countries experienced excess mortality in 2022, ranging from 8.6 (Peru) to 116.2 (Georgia) per 100 000 population, noting that rates were not directly comparable across countries. Many countries had higher excess mortality in 2022 compared with previous years. Mauritius showed a significant excess mortality for the first time in 2022. The proportion of COVID-19 deaths relative to total deaths decreased in 2022 for most countries, except Australia. Governmental control measures and vaccinations were associated with reduced excess mortality in 2021 and 2022, respectively.
Conclusion: The study reveals sustained excess mortality throughout 2022. Excess deaths were mainly non-COVID-19-related, likely due to displaced mortality or to broader long-term impacts of the pandemic response. Governmental control policies and vaccination efforts were associated with lower excess mortality. These findings provide critical insights into pandemic mortality dynamics and emphasize the need for continued vigilance and adaptive public health strategies.
Keywords: COVID-19; all-cause mortality; excess mortality; governmental control measures; indirect mortality; vaccination.
© The Author(s) 2025. Published by Oxford University Press on behalf of the International Epidemiological Association.
Figures
References
MeSH terms
Grants and funding
LinkOut - more resources
Full Text Sources
Medical
