. 2025 Jul 22;10(7):e0051825.
doi: 10.1128/msystems.00518-25. Epub 2025 Jun 10.

The potential mechanisms of reciprocal regulation of gut microbiota-liver immune signaling in metabolic dysfunction-associated steatohepatitis revealed in multi-omics analysis

Affiliations

The potential mechanisms of reciprocal regulation of gut microbiota-liver immune signaling in metabolic dysfunction-associated steatohepatitis revealed in multi-omics analysis

Zhaoyang Lu et al. mSystems. .

Abstract

As a commonly known aggressive liver-related manifestation within the spectrum of metabolic syndrome with a significant risk of progressing to cirrhosis and hepatocellular carcinoma, metabolic dysfunction-associated steatohepatitis (MASH) is closely intertwined with obesity, insulin resistance, and dyslipidemia. Although the gut microbiota is implicated in MASH progression, the underlying mechanisms require further investigation. In this study, we sought to combine the analysis of the liver transcriptome, circulating metabolome, and gut microbiota to investigate the potential molecular mechanisms underlying the reciprocal regulation between gut microbiota and liver immune signaling. We utilized a high-fat and methionine/choline-deficient diet (HFMCD)-induced MASH model in a db/db mouse. Following annotation analysis using KEGG and Metorigin, a comprehensive correlation analysis was conducted among these genes and specific metabolites (such as L-glutamine, isocitric acid, putrescine, pyroglutamic acid, rhamnose) and gut microbiota genera (Enteroccus and Romboutsia). The results revealed intricate interactions among the liver's immune microenvironment, the metabolome, and the gut microbiota. These interactions suggest a potential regulatory mechanism for metabolic disorders and immune responses.IMPORTANCEOur multi-omics analysis showed that the interactions between gut microbiota and liver immune responses mediated by the disorders in lipid, amino acid, and glucose metabolism are associated with activation of the JAK-STAT and NF-κB signaling pathway in MASH. The multi-omics analysis provides valuable insights into the interactions among microbiota, circulating metabolites, and immune signaling. These insights can be harnessed to enhance the management of MASH.

Keywords: MASH; gut microbiota; metabolome; multi-omics analysis; transcriptome.


Conflict of interest statement

The authors declare no conflict of interest.

Figures

Fig 1
Fig 1
The altered transcriptome and immune signaling in the liver (n = 3). (A) Volcanic plot of DEGs between the MASH and Control Groups. (B) Venn diagram constructed from the identified genes. (C) Heatmap displaying the expression abundance of DEGs. (D) GSEA plot for inflammation- and immune-related GO_BP terms between the MASH and the Control Groups. (E) Lollipop plots representing the top 30 significant pathways, excluding those within the Human Diseases and Organismal Systems category, based on the KEGG database. (F) Pathway enrichment analysis of overlapping downregulated (reference threshold: fold change, <0.5; P.adjust value, <0.05) and upregulated (reference threshold; fold change, >2; P.adjust value <0.05) genes was performed based on the GO database. (G) Network diagram of the top 25 GO_BP terms. (H) KEGG enrichment sankey bubble plots for the selected gene sets.
Fig 2
Fig 2
The aberrant metabolome of MASH and its interactions with co-metabolism genes (n = 3). (A) The principal component analysis was used to illustrate the differences of metabolites between the two groups: (B) partial least squares discriminant analysis and (C) orthogonal partial least squares discriminant analysis score plots. (D) A volcanic plot shows the DMs between the MASH and the Control groups. (E) A pie plot of the HMDB Superclass of DMs between the two groups is provided. (F) The KEGG terms of DMs from enrichment analysis are depicted. (G) A Venn diagram demonstrates the correlation between transcriptomics and metabolomics pathways. (H) A heatmap shows the relative expression abundance and VIP of 44 metabolites. (I) The associations between liver differentially expressed genes and serum differential metabolites within 18 shared pathways are presented. Each co-occurring pair between two items had an absolute Spearman correlation coefficient greater than 0.92 (orange solid line for positive correlation (r ≥ 0.92); green dashed line for negative correlation (r ≤ −0.92)), with P-values below 0.01. The size of the nodes is proportional to their connectivity with other nodes in the network.
Fig 3
Fig 3
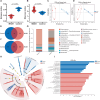
Characterization of gut microbiota in the control and MASH groups (n = 3). (A) The differences in alpha diversity between the two groups are shown by the Shannon index (Student’s t-test) and (B) the Simpson index (Student’s t-test). (C) Multiple-sample principal component analysis (PCA) was performed at the genus level and (D) the species level. (E) Venn diagrams show the relationships between the two groups at the genus level and (F) the species levels. (G) Stacked bar graphs depict the relative abundance of the top 20 genera. (H) The LEfSe was used to identify differences in community composition between the two groups. In the figure, nodes of different colours represent significant effects on the differences between the groups. (I) The column chart displays biomarkers for genera with an at LDA score of >3.
Fig 4
Fig 4
The aberrant microbiome of MASH and its interactions with potential gut microbiota metabolites. (A) Barplots were utilized to illustrate the potential origins of differential metabolites, along with the corresponding number of metabolites from each source. (B) A Venn diagram was employed to demonstrate the correlation between host and microbiota metabolites. (C) A circular heatmap was generated to display the predicted metabolic pathways with different abundances between groups. (D) A scatterplot was presented to show metabolite enrichment pathways of potential gut microbiota. (E) A Venn diagram was constructed to represent the interrelationship of the top 150 enriched predicted metabolic pathways with potential gut microbiota metabolites. (F) Column graphs were created to depict gut microbial differences at the genus level based on Wilcoxon’s rank sum test. (G) The associations between gut differential genera and serum differential metabolites in 24 shared pathways were analyzed. Each co-occurring pair between two items had an absolute Spearman correlation above 0.81 (orange solid line for positive correlation (r ≥ 0.81); green dashed line for negative correlation (r ≤ −0.81)), with P-values below 0.05. Additionally, the size of nodes was proportional to the degree of connectivity with other nodes in the network.
Fig 5
Fig 5
The variations in gut microbiota genera and serum metabolites exhibit pronounced associations with genes expression of the JAK-STAT and NF-κB signaling pathways, as well as metabolism-related genes expression. (A) Through Mantel analysis, both 46 metabolism-related genes and 10 differential genera were linked to each of the 44 metabolites, respectively. Among these, 17 of these metabolites were significantly associated with metabolism-related genes and 10 differential genera (Mantel’s P < 0.05, and Mantel’s r > 0.5). (B) Using Mantel analysis, both 20 genes of the JAK-STAT and NF-κB signaling pathways and 10 differential genera were each linked to 30 metabolites. Among these, nine metabolites were significantly associated with the genes and 10 differential genera (Mantel’s P < 0.05, and Mantel’s r > 0.5). (C) The correlation between the 10 genera and genes expression in 18 co-enriched metabolic pathways was investigated. (D) The correlation between the 10 genera and the genes expression of the JAK-STAT and NF-κB signaling pathway was explored. (E) The correlation between the 10 genera and the 17 serum metabolites was analyzed. (F) The correlation between the liver genes of the JAK-STAT and NF-κB signaling pathways and the nine serum metabolites was examined. The red line indicates a positive correlation (r ≥ 0.81); the blue line indicates a negative correlation (r ≤ −0.81), and the size of nodes was proportional to the degree of connectivity with other nodes in the network.

Similar articles

References

    1. Younossi ZM, Golabi P, Paik JM, Henry A, Van Dongen C, Henry L. 2023. The global epidemiology of nonalcoholic fatty liver disease (NAFLD) and nonalcoholic steatohepatitis (NASH): a systematic review. Hepatology 77:1335–1347. doi: 10.1097/HEP.0000000000000004 - DOI - PMC - PubMed
    1. Rinella ME, Lazarus JV, Ratziu V, Francque SM, Sanyal AJ, Kanwal F, Romero D, Abdelmalek MF, Anstee QM, Arab JP, et al. 2023. A multisociety Delphi consensus statement on new fatty liver disease nomenclature. Hepatology 78:1966–1986. doi: 10.1097/HEP.0000000000000520 - DOI - PMC - PubMed
    1. Eslam M, Sanyal AJ, George J, International Consensus Panel . 2020. MAFLD: a consensus-driven proposed nomenclature for metabolic associated fatty liver disease. Gastroenterology 158:1999–2014. doi: 10.1053/j.gastro.2019.11.312 - DOI - PubMed
    1. Harrison SA, Allen AM, Dubourg J, Noureddin M, Alkhouri N. 2023. Challenges and opportunities in NASH drug development. Nat Med 29:562–573. doi: 10.1038/s41591-023-02242-6 - DOI - PubMed
    1. Ledford H. 2024. First US drug approved for a liver disease surging around the world. Nature. doi: 10.1038/d41586-024-00747-9 - DOI - PubMed

LinkOut - more resources