Integrative analyses of 16S rDNA sequencing and serum metabolomics demonstrate significant roles for the oral microbiota and serum metabolites in post-kidney transplant diabetes mellitus
- PMID: 40492760
- PMCID: PMC12211015
- DOI: 10.1128/spectrum.00892-25
Integrative analyses of 16S rDNA sequencing and serum metabolomics demonstrate significant roles for the oral microbiota and serum metabolites in post-kidney transplant diabetes mellitus
Abstract
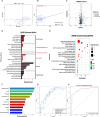
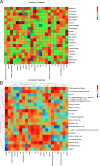
Oral microbiota and serum metabolites play crucial roles in diabetes, but their relationship with post-transplant diabetes mellitus (PTDM), a common complication post-kidney transplantation, is not well characterized. This study investigated the relationship of oral microbiota and serum metabolites with PTDM using integrative analysis of 16S rDNA sequencing and serum metabolomics. We recruited 61 kidney transplant recipients, including 30 in the PTDM group and 31 in normal glucose tolerance controls. Oral samples and serum samples were collected from all the kidney transplant patients to perform 16S rDNA sequencing and serum metabolomics analysis. We annotated 689 oral microbial species, including 134 species unique to the PTDM group and 157 species unique to the control group. PTDM group showed upregulation of 36 metabolites and downregulation of 19 metabolites. Based on the random forest machine learning algorithm, genera such as UCG-005 (AUC = 0.9355), Succinivibrio (AUC = 0.8108); Akkermansia (AUC = 0.7742), Anaerovibrio (AUC = 0.2667), and Schwartzia (AUC = 0.2667), and serum metabolites such as LPI 18:0 (AUC: 0.8086), methylglyoxal (AUC: 0.7946), Vulgarin (AUC: 0.7828), 2-mercaptobenzothiazole (AUC: 0.7591), and PI(18:0/20:3(5Z,8Z,11Z)) (AUC: 0.7419) showed high diagnostic potential and may serve as clinical biomarkers. Furthermore, clinical indicators in PTDM patients, such as creatinine, cystatin C, and urea, showed a significant association with the differential oral microbiota and serum metabolites. Dysbiosis in the oral microbiota of the PTDM patients was associated with changes in the serum metabolites and alterations in their functions. These findings provide new insights toward identifying mechanisms by which oral microbiota and serum metabolites contribute to the development of PTDM.IMPORTANCEThis study reveals an imbalance in oral microbiota in patients with post-transplant diabetes and uncovers the potential relationship between oral microbiota and serum metabolites. These findings provide new insights into the role of oral microbiota and serum metabolites in the treatment of post-transplant diabetes, offering relevant biomarkers for clinicians and future research.
Keywords: kidney transplantation; oral microbiota; post-transplant diabetes mellitus; serum metabolites.
Conflict of interest statement
The authors declare no conflict of interest.
Figures


Similar articles
-
Changes in the gut microbiota and derived fecal metabolites may play a role in tacrolimus-induced diabetes in mice.Future Microbiol. 2025 Feb;20(3):237-246. doi: 10.1080/17460913.2024.2444761. Epub 2024 Dec 22. Future Microbiol. 2025. PMID: 39711145
-
Integrated multi-omics analysis reveals the functional signature of microbes and metabolomics in pre-diabetes individuals.Microbiol Spectr. 2025 Jul;13(7):e0145924. doi: 10.1128/spectrum.01459-24. Epub 2025 Jun 9. Microbiol Spectr. 2025. PMID: 40488467 Free PMC article.
-
Will gut, oral, and vaginal microbiota influence the outcome of FET or be influenced by FET? A pilot study.mBio. 2025 Jul 9;16(7):e0050925. doi: 10.1128/mbio.00509-25. Epub 2025 Jun 17. mBio. 2025. PMID: 40525871 Free PMC article.
-
Glucose-lowering agents for treating pre-existing and new-onset diabetes in kidney transplant recipients.Cochrane Database Syst Rev. 2017 Feb 27;2(2):CD009966. doi: 10.1002/14651858.CD009966.pub2. Cochrane Database Syst Rev. 2017. Update in: Cochrane Database Syst Rev. 2020 Jul 30;8:CD009966. doi: 10.1002/14651858.CD009966.pub3. PMID: 28238223 Free PMC article. Updated.
-
Synbiotics, prebiotics and probiotics for solid organ transplant recipients.Cochrane Database Syst Rev. 2022 Sep 20;9(9):CD014804. doi: 10.1002/14651858.CD014804.pub2. Cochrane Database Syst Rev. 2022. PMID: 36126902 Free PMC article.
References
-
- Hariharan S, Rogers N, Naesens M, Pestana JM, Ferreira GF, Requião-Moura LR, Foresto RD, Kim SJ, Sullivan K, Helanterä I, Goutaudier V, Loupy A, Kute VB, Cardillo M, Tanabe K, Åsberg A, Jensen T, Mahillo B, Jeong JC, Anantharaman V, Callaghan C, Ravanan R, Manas D, Israni AK, Mehta RB. 2024. Long-term kidney transplant survival across the globe. Transplantation 108:e254–e263. doi: 10.1097/TP.0000000000004977 - DOI - PubMed
-
- Alfieri C, Campioli E, Fiorina P, Orsi E, Grancini V, Regalia A, Campise M, Verdesca S, Delfrate NW, Molinari P, Pisacreta AM, Favi E, Messa P, Castellano G. 2024. Post-transplant diabetes mellitus in kidney-transplanted patients: related factors and impact on long-term outcome. Nutrients 16:1520. doi: 10.3390/nu16101520 - DOI - PMC - PubMed
MeSH terms
Substances
Grants and funding
- Qiankehe Basic-ZK[2023] General 380/Science and Technology Program of Guizhou Province
- Qiankehe Basic-ZK(2024)247/Science and Technology Program of Guizhou Province
- gyfynsfc[2024]-50/Training Program of the National Natural Science Foundation of China, Affiliated Hospital of Guizhou Medical University
LinkOut - more resources
Full Text Sources
Medical
Research Materials
Miscellaneous

