

Thioredoxin-interacting protein is associated with obesity-induced insulin resistance in PCOS patients: a large-scale case-control study
- PMID: 40493072
- PMCID: PMC12374887
- DOI: 10.1007/s00404-025-08059-7
Thioredoxin-interacting protein is associated with obesity-induced insulin resistance in PCOS patients: a large-scale case-control study
Abstract
Purpose: Polycystic ovary syndrome (PCOS) is a common endocrine disorder often associated with obesity and insulin resistance (IR), though the role of thioredoxin-interacting protein (TXNIP) in obesity-induced IR in PCOS remains unclear. This study explores the relationship between TXNIP levels and obesity-associated IR in women with PCOS.
Methods: A case-control study was conducted from January 2019 to December 2020, including 161 women with PCOS and 107 healthy controls. PCOS patients were categorized into insulin-resistant (IR) and non-IR subgroups, further divided by BMI into obese, overweight, and normal weight groups. The metabolic parameters such as cholesterol, triglycerides, fasting blood glucose, homocysteine, and serum TXNIP levels were measured. Logistic regression assessed the relationship between TXNIP expression and metabolic dysfunction.
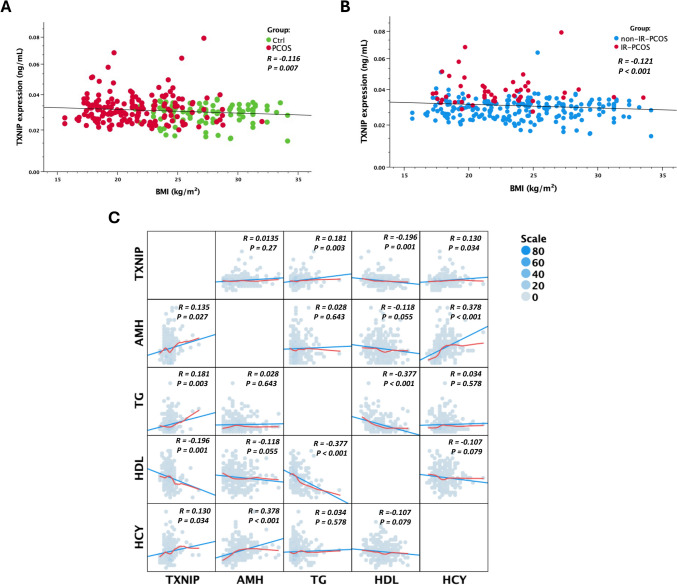
Results: TXNIP levels were significantly higher in the PCOS group compared to controls (67% increase), with a further 56% increase in the IR subgroup. The TXNIP levels were elevated in the obese group compared to overweight and normal weight groups (P < 0.05). TXNIP expression was negatively correlated with obesity (R = - 0.116, P = 0.007) and HDL cholesterol (R = - 0.196, P = 0.001), but positively associated with triglycerides (R = 0.181, P = 0.003) and homocysteine (R = 0.130, P = 0.034). After adjusting for confounders, TXNIP remained significantly associated with IR (P < 0.05). TXNIP demonstrated excellent diagnostic performance in distinguishing IR from non-IR PCOS patients, with an AUC of 0.89 (95% CI 0.84-0.94; P < 0.001).
Conclusions: TXNIP is significantly correlated with IR in women with PCOS, highlighting its potential as a biomarker for metabolic abnormalities. Further research is needed to fully understand its role in obesity-induced IR in PCOS.
Keywords: Insulin resistance; Metabolic; Obesity; Polycystic ovary syndrome; Thioredoxin-interacting protein.
© 2025. The Author(s).
Conflict of interest statement
Declarations. Conflict of interest: The authors declare no competing interests. Ethics approval: This study was approved by the Ethics Committee of Hangzhou Women’s Hospital (approval number: 2018–04-03), in compliance with the Declaration of Helsinki. Before participation, all participants were fully informed about the study’s purpose, procedures, potential risks, and benefits. All sampling and laboratory procedures were conducted following the ethical guidelines of the hospital’s Ethics Committee, ensuring participant privacy and safety. Identifiers were removed from data to maintain confidentiality, and all data were stored securely. Consent to participate: Informed consent was obtained from all individual participants included in the study. Consent to publish: Not applicable.
Figures


Similar articles
-
Elevated Triglyceride-Glucose Index Is Associated With Insulin Resistance, Metabolic Syndrome Components, Nonalcoholic Fatty Liver Disease, and Adverse Pregnancy Outcomes in Chinese Women With Polycystic Ovary Syndrome.Clin Endocrinol (Oxf). 2025 Sep;103(3):317-326. doi: 10.1111/cen.15252. Epub 2025 Apr 29. Clin Endocrinol (Oxf). 2025. PMID: 40298068 Free PMC article.
-
Polycystic ovary syndrome and excessive body weight impact independently and synergically on fertility treatment outcomes.Reprod Biol Endocrinol. 2025 Jul 7;23(1):97. doi: 10.1186/s12958-025-01434-8. Reprod Biol Endocrinol. 2025. PMID: 40624700 Free PMC article.
-
Alterations of insulin sensitivity, clearance, and secretion, either alone or in combination, in women with PCOS: impact on metabolic profile and androgenemia.Hum Reprod. 2025 Aug 1;40(8):1550-1561. doi: 10.1093/humrep/deaf114. Hum Reprod. 2025. PMID: 40514041
-
Insulin resistance in polycystic ovary syndrome: a systematic review and meta-analysis of euglycaemic-hyperinsulinaemic clamp studies.Hum Reprod. 2016 Nov;31(11):2619-2631. doi: 10.1093/humrep/dew243. Epub 2016 Oct 7. Hum Reprod. 2016. PMID: 27907900
-
A systematic review of GLP-1 on anthropometrics, metabolic and endocrine parameters in patients with PCOS.Womens Health (Lond). 2024 Jan-Dec;20:17455057241234530. doi: 10.1177/17455057241234530. Womens Health (Lond). 2024. PMID: 38444070 Free PMC article.
References
-
- Joham AE, Norman RJ, Stener-Victorin E, Legro RS, Franks S, Moran LJ, Boyle J, Teede HJ (2022) Polycystic ovary syndrome. Lancet Diabetes Endocrinol 10(9):668–680. 10.1016/s2213-8587(22)00163-2 - PubMed
-
- Miazgowski T, Martopullo I, Widecka J, Miazgowski B, Brodowska A (2021) National and regional trends in the prevalence of polycystic ovary syndrome since 1990 within Europe: the modeled estimates from the Global Burden of Disease Study 2016. Arch Med Sci 17(2):343–351. 10.5114/aoms.2019.87112 - PMC - PubMed
MeSH terms
Substances
LinkOut - more resources
Full Text Sources
Medical
