. 2025 Jun 10;10(14):e187799.
doi: 10.1172/jci.insight.187799. eCollection 2025 Jul 22.

Emerin is an effector of oncogenic KRAS-driven nuclear dynamics in pancreatic cancer

Affiliations

Emerin is an effector of oncogenic KRAS-driven nuclear dynamics in pancreatic cancer

Luis F Flores et al. JCI Insight. .

Abstract

For over a century, scientists reported the disruption of normal nuclear shape and size in cancer. These changes have long been used as tools for diagnosis and staging of malignancies. However, to date, the mechanisms underlying these aberrant nuclear phenotypes and their biological significance remain poorly understood. Using a model of pancreatic ductal adenocarcinoma (PDAC), the major histological subtypes of pancreatic cancer, we found that oncogenic mutant KRAS reduces nuclear size. Transcriptomic and protein expression analysis of mutant KRAS-expressing PDAC cells revealed differential levels of several nuclear envelope-associated genes. Further analysis demonstrated the nuclear lamina protein, Emerin (EMD), acted downstream of KRAS to mediate nuclear size reduction in PDAC. Analysis of human PDAC samples showed that increased EMD expression associates with reduced nuclear size. Finally, in vivo genetic depletion of EMD in a mutant KRAS-driven PDAC model resulted in increased nuclear size and a reduced incidence of poorly differentiated PDAC. Thus, our data provide evidence of a potentially novel mechanism underlying nuclear size regulation and its effect in PDAC carcinogenesis.

Keywords: Cancer; Cell biology; Oncology.


Conflict of interest statement

Conflict of interest: The authors have declared that no conflict of interest exists.

Figures

Figure 1
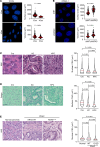
Figure 1. KRASG12D induces nuclear size reduction in PDAC.
(A) –Dox and +Dox 1012U cells (DAPI stained) with quantification of nuclear surface area and nuclear volume (–Dox n = 405; +Dox n = 383 nuclei). Scale bar: 20 μm. Scatter dot plot: median ± interquartile range. Significant difference was determined by Mann Whitney U test. (B) DAPI stained iPANC-1 cells expressing either shNT or shKRAS with quantification of nuclear surface area and volume (shNT n = 121; shKRAS n = 120 nuclei). Scale bar: 10 μm. Scatter dot plot: median ± interquartile range. Significant difference was determined by Mann Whitney U test. (C) H&E staining of mouse pancreas tissue with quantification of nuclear CSA (Cre n = 159,742; KC n = 500,001; KPC n = 589,902 nuclei). Scale bar: 25 μm. Violin plot: median ± interquartile range. Significant difference was determined by Kruskal-Wallis test, followed by Dunn’s multiple-comparison test. (D) Feulgen staining of Cre, KC, and KPC mice with quantification of nuclear CSA (Cre n = 75,697; KC n = 97,900; KPC n = 97,865 nuclei). Scale bar: 200 μm. Violin plot: median ± interquartile range. Significant difference was determined by Kruskal-Wallis test, followed by Dunn’s multiple-comparison test. (E) H&E stained human normal pancreata and PDAC tissues with quantification of nuclear CSA from normal, WT and mutant (KrasG12D) samples (n = 5/case) (Normal n = 56,046; Kras WT n = 89,336; KrasG12D n = 79,679 nuclei). Scale bar: 50 μm. Violin plot: median ± interquartile range. Significant difference was determined by Kruskal-Wallis test, followed by Dunn’s multiple-comparison test.
Figure 2
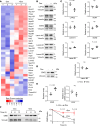
Figure 2. EMD protein levels are stabilized by oncogenic KRAS.
(A) RNA-Seq heatmap of nuclear envelope genes from –Dox and +Dox 1012U cells (n = 3/group) 72 hours after doxycycline treatment. (B) Western blot screen of nuclear envelope proteins in 1012U cell under –/+Dox condition. (C) Densitometry for nuclear envelope proteins normalized to Vinculin (n = 3/group). Scatter dot plot: mean ± SEM. Significant difference was determined by Student’s t test. (D) Western blot of EMD protein with Vinculin loading control in 1012U –/+Dox condition. (E) Densitometry for EMD protein levels normalized to Vinculin and qPCR of EMD gene expression relative to mPrt/Tbp (n ≥ 3). Scatter dot plot: mean ± SEM. Significant difference was determined by Student’s t test (protein expression) and Mann Whitney U test (mRNA expression). (F) Cycloheximide assay for 0-, 6-, and 12-hour time points in 1012U –/+Dox condition followed by EMD Western blot with densitometry quantification relative to Vinculin (n = 3/group). Line plot: mean ± SEM. Significant difference at each time point was determined by Student’s t test.
Figure 3
Figure 3. EMD is required by KRASG12D to regulate nuclear size.
(A) IF of +Dox condition 1012U cells transfected with siNT and siEMD, with quantification of nuclear surface area and volume (siNT n = 226; siEMD n = 233 nuclei). (B) Nuclear surface and volume quantification (siNT n = 143; siEMD n = 115 nuclei) of PANC-1 cells transfected with siNT and siEMD. (A and B) Scale bars: 10 μm. Scatter dot plot: median ± interquartile range. Significant difference was determined by Mann Whitney U test.
Figure 4
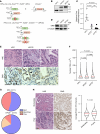
Figure 4. EMD is an effector of nuclear size change downstream of oncogenic KRAS in vivo.
(A) Schematic representing animal crosses to generate Ptf1a-Cre, LSL-KrasG12D, Trp53+/–, EMD+/–, or EMD–/– (KPCE) mice using Ptf1a-Cre, LSL-KrasG12D, or Trp53+/– (KPC) with EMD+/– or EMD–/– mice. (B) Pancreatic tissue confirmation of EMD recombination. WT = 349 bp, Emd+/– = 349/490 bp, Emd–/– = 490 bp. (C) qPCR of Emd expression relative to mPrt/Tbp in pancreata from KPC (n = 4), KPCE+/– (n = 3), and KPCE–/– (n = 9) mice. Scatter dot plot: mean ± SEM. Significant difference was determined by ANOVA, followed by Tukey’s multiple-comparison test. (D) Western blot of mice pancreas for EMD protein level with α-tubulin loading control. (E) H&E-stained pancreatic tumors from KPC, KPCE+/–, and KPCE–/– mice. Scale bar: 50 μm. IHC staining of EMD; arrow heads indicate positive EMD expression. Scale bar: 200 μm. (F) Quantification of nuclear CSA from H&E-stained pancreatic tumors from KPC, KPCE+/–,, and KPCE–/– mice (KPC n = 456,858 nuclei; KPCE+/– n = 572,027 nuclei; KPCE–/– n = 451,757 nuclei). Violin plot: median ± interquartile range. Significant difference was determined by Kruskal-Wallis test, followed by Dunn’s multiple-comparison test. (G) Histopathological analysis of KPC (n = 11) and KPCE–/– (n = 16) pancreatic tumors. (H) H&E and IHC staining of EMD in moderately and poorly differentiated human PDAC samples, and quantification of EMD intensity by grade. Moderately differentiated PDAC nuclei = 47,963 from n = 22 cases, poorly differentiated PDAC nuclei = 50,056 nuclei from n = 15 cases. Scale bar: 80 μm. Violin plot: median ± interquartile range. Significant difference was determined by Mann Whitney U test.

References

    1. Schirmer EC, de las Heras JI, eds. Cancer Biology and the Nuclear Envelope. Springer; 2014.
    1. Rizzotto A, Schirmer EC. Breaking the scale: how disrupting the karyoplasmic ratio gives cancer cells an advantage for metastatic invasion. Biochem Soc Trans. 2017;45(6):1333–1344. doi: 10.1042/BST20170153. - DOI - PubMed
    1. Edens LJ, Levy DL. cPKC regulates interphase nuclear size during Xenopus development. J Cell Biol. 2014;206(4):473–483. doi: 10.1083/jcb.201406004. - DOI - PMC - PubMed
    1. Levy DL, Heald R. Nuclear size is regulated by importin α and Ntf2 in Xenopus. Cell. 2010;143(2):288–298. doi: 10.1016/j.cell.2010.09.012. - DOI - PMC - PubMed
    1. Mukherjee RN, et al. The perinuclear ER scales nuclear size independently of cell size in early embryos. Dev Cell. 2020;54(3):395–409. doi: 10.1016/j.devcel.2020.05.003. - DOI - PMC - PubMed

MeSH terms