. 2025 Jun 10;135(15):e188819.
doi: 10.1172/JCI188819. eCollection 2025 Aug 1.

Wilms tumor 1 impairs apoptotic clearance of fibroblasts in distal fibrotic lung lesions

Affiliations

Wilms tumor 1 impairs apoptotic clearance of fibroblasts in distal fibrotic lung lesions

Harshavardhana H Ediga et al. J Clin Invest. .

Abstract

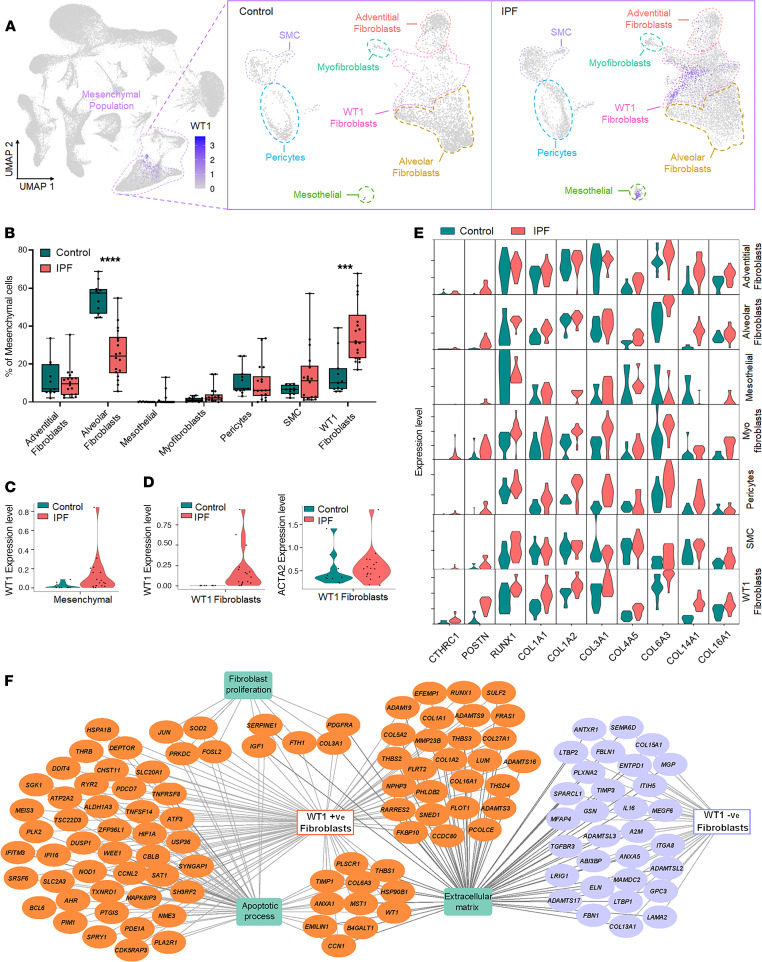
Idiopathic pulmonary fibrosis (IPF) is a fatal fibrotic lung disease characterized by impaired fibroblast clearance and excessive extracellular matrix (ECM) protein production. Wilms tumor 1 (WT1), a transcription factor, is selectively upregulated in IPF fibroblasts. However, the mechanisms by which WT1 contributes to fibroblast accumulation and ECM production remain unknown. Here, we investigated the heterogeneity of WT1-expressing mesenchymal cells using single-nucleus RNA-Seq of distal lung tissues from patients with IPF and control donors. WT1 was selectively upregulated in a subset of IPF fibroblasts that coexpressed several prosurvival and ECM genes. The results of both loss-of-function and gain-of-function studies were consistent with a role for WT1 as a positive regulator of prosurvival genes to impair apoptotic clearance and promote ECM production. Fibroblast-specific overexpression of WT1 augmented fibroproliferation, myofibroblast accumulation, and ECM production during bleomycin-induced pulmonary fibrosis in young and aged mice. Together, these findings suggest that targeting WT1 is a promising strategy for attenuating fibroblast expansion and ECM production during fibrogenesis.

Keywords: Apoptosis; Extracellular matrix; Fibrosis; Inflammation; Pulmonology.


Conflict of interest statement

Conflict of interest: The authors have declared that no conflict of interest exists.

Figures

Figure 1
Figure 1. snRNA-Seq of lung cells in the distal regions of normal and IPF lungs.
(A) Schematic of lung single-nucleus sample preparation and the workflow for snRNA sequencing and analysis. (B) UMAP plot of all cells colored according to IPF (n = 18) and control donor (n = 11) lung samples. Each dot on the UMAP represents a nucleus. (C) UMAP plot of 4 major cell lineages colored to denote epithelial, endothelial, mesenchymal, and immune cell types. (D) UMAP plot of all 28 unique cell subpopulations identified. (E) Heatmaps showing marker gene expression across 28 identified cell types, grouped into 4 major lineages. Each row represents gene expression across cell types from all samples, whereas each column shows the average gene expression per individual, grouped by disease condition. Only genes with an adjusted P value of less than 0.05 (Wilcoxon rank-sum test) are shown. Scaled gene expression values are used for visualization.
Figure 2
Figure 2. Fibroblast heterogeneity and identification of WT1 fibroblasts in the distal regions of IPF lungs.
(A) UMAP plots showing normalized WT1 gene expression for all cells and further subdivided by IPF and control donor lung samples with 7 mesenchymal cell types. Color intensity reflects expression levels, with darker shades indicating higher expression. (B) Boxplots showing the proportion of each cell type within mesenchymal cell types across IPF and control donor lung samples. Each dot represents an individual sample, and the proportions sum to 100% per sample. ***P < 0.001 and ****P < 0.0001, by multiple 2-tailed Student’s t tests. (C) Violin plot showing the average WT1 expression in the mesenchymal cell population, compared between control and IPF samples. Each dot represents an individual sample. P < 0.05, by Wilcoxon rank-sum test. (D) Violin plot showing the average WT1 expression in the WT1 fibroblast population, compared between control and IPF samples. Each dot represents an individual sample. P < 0.05, by Wilcoxon rank-sum test. (E) Violin plots showing the average expression of fibrosis-associated genes (CTHRC1, POSTN, RUNX1, and collagen genes) across all mesenchymal cell subpopulations, comparing control and IPF samples. (F) DEGs in WT1-positive cells and WT1-negative cells of the WT1 fibroblast population were analyzed using ToppFun and visualized using CytoScape. Orange- and purple-colored circles represent genes that were upregulated in WT1-positive cells and WT1-negative cells, respectively. The green-colored boxes represent enriched biological processes for the DEGs.
Figure 3
Figure 3. WT1 is upregulated in IPF distal lung mesenchymal cells.
(A) Immunostaining was performed with the anti-WT1 antibody on lung sections from control and individuals with IPF. Representative images of pleural and parenchymal regions were obtained at low (original magnification, ×20; scale bar: 200 μm) and high (original magnification, ×40; scale bar: 100 μm) magnification. Arrowheads highlight WT1 staining on pleural mesothelial cells and spindle-shaped fibroblasts in the distal fibrotic lesions of lung parenchyma. (B) Representative fluorescence confocal RNA-ISH images showing WT1 (red) and ACTA2 (green) expression in control and IPF lung tissues. White arrowheads illustrate the double-positive cells. Scale bars: 20 μm. (C) Quantification of WT1+ cells normalized to total lung cells in lung section images from IPF and control lungs (n = 4/group). **P < 0.01, by 2-tailed Student’s t test. (D) Quantification of mesenchymal cells double-positive for WT1 and ACTA2 among total lung cells in lung section images from IPF and control lungs (n = 4/group). ***P < 0.001, by 2-tailed Student’s t test. (E) Primary lung-resident fibroblasts isolated from lung cultures of control and IPF lungs were immunoblotted with antibodies against WT1 and GAPDH. (F) WT1 protein levels were normalized to GAPDH and are shown as fold change (n = 3/group). *P < 0.05, by 2-tailed Student’s t test. (G) WT1 transcripts were measured by RT-PCR in normal lung fibroblasts treated with media, TGF-α (50 ng/mL), or TGF-β1 (20 ng/mL) for 16 hours (n = 4/group). **P < 0.01, by 1-way ANOVA.
Figure 4
Figure 4. Loss of WT1 attenuates the expression of genes involved in fibroblast survival and ECM production.
(A) Quantification of both proapoptotic (BAX and BIM) and antiapoptotic (BCL2-L2, BCL-XL, and BCL3) gene transcripts using RT-PCR in IPF fibroblasts treated with either control or WT1 specific siRNA for 72 hours. Multiple unpaired, 2-tailed Student’s t tests were used for comparisons (n = 3/group). *P < 0.05, **P < 0.01, and ***P < 0.001, by multiple unpaired, 2-tailed Student’s t tests. (B) Quantification of collagen gene transcripts (COL1A1 and COL6A3) using RT-PCR in IPF fibroblasts treated with either control or WT1-specific siRNA for 72 hours (n = 3/group). *P < 0.05, and ***P < 0.001, by multiple unpaired, 2-tailed Student’s t tests. (C and D) IPF fibroblasts were treated with either control or WT1-specific siRNA for 72 hours, and cell lysates were immunoblotted with antibodies against WT1, FAS, BCL-XL, or GAPDH. Quantification of WT1, FAS, and BCL-XL protein levels normalized to GAPDH (n = 3/group). *P < 0.05, by 2-tailed Student’s t test. (EI) IPF fibroblasts were treated with either control or WT1-specific siRNA for 72 hours, and cell lysates were immunoblotted with antibodies against COL1α1, FN1, ELN, αSMA, or GAPDH. Quantification of COL1α1, FN1, ELN, and αSMA protein levels normalized to GAPDH (n = 3/group). *P < 0.05 and ***P < 0.001, by 2-tailed Student’s t test. (J) IPF fibroblasts were treated with either control or WT1-specific siRNA for 48 hours, followed by anti-Fas antibody treatment for another 24 hours, and cells were stained to quantify total TUNEL+ cells. Representative confocal images were obtained at ×20 original magnification. Scale bars: 100 μm. (K) The percentage of TUNEL+ (red color) cells in the total DAPI-stained (blue color) cells was quantified using MetaMorph image analysis. One-way ANOVA was used for comparisons (n = 3/group). *P < 0.05, **P < 0.01, and ****P < 0.0001, by 1-way ANOVA for comparisons.
Figure 5
Figure 5. WT1 functions as a positive regulator of lung-resident fibroblast survival.
(A) Quantification of prosurvival gene (HSP90B1, and PIM1) transcripts using RT-PCR in normal lung fibroblasts transduced with either control or WT1-overexpressing adenoviral particles for 72 hours (n = 3/group). *P < 0.05 and ****P < 0.0001, by multiple unpaired, 2-tailed Student’s t tests for comparisons. (B) Normal lung fibroblasts were transduced with either control or WT1-overexpressing adenoviral particles for 72 hours, and prosurvival gene (BCL2, BCL2-L2, BCL-XL, and BCL3) transcript levels were quantified by RT-PCR (n = 3/group). **P < 0.01, by multiple unpaired, 2-tailed Student’s t tests. (C) Normal lung fibroblasts were transduced with either control or WT1-overexpressing adenoviral particles for 72 hours, and ECM-associated gene (COL1A1, COL6A3, and COL16A1) transcript levels were quantified by RT-PCR (n = 3/group). *P < 0.05 and **P < 0.01, by multiple unpaired, 2-tailed Student’s t tests. (DI) Normal lung fibroblasts were transduced with either control or WT1-overexpressing adenoviral particles for 72 hours, and cell lysates were immunoblotted with antibodies against WT1, BAD, BAX, FAS, αSMA, or GAPDH. Quantification of WT1, BAD, BAX, FAS, and αSMA protein levels normalized to GAPDH (n = 3/group). *P < 0.05, **P < 0.01, and ***P < 0.001, by 2-tailed Student’s t test. (J) Normal lung fibroblasts were treated with either control or WT1-overexpressing adenoviral particles for 48 hours, followed by anti-Fas antibody treatment for another 24 hours, and fibroblasts were stained for TUNEL (red). Representative confocal images are shown; nuclei were stained with DAPI (blue). Original magnification, ×20. Scale bars: 100 μm. Yellow arrowheads highlight TUNEL+ apoptotic cells. (K) Quantification of TUNEL+ fibroblasts using MetaMorph image analysis (n = 3/group). *P < 0.05 and ****P < 0.0001, by 1-way ANOVA.
Figure 6
Figure 6. Overexpression of WT1 augments prosurvival gene expression in mouse lung resident fibroblasts.
(A) Schematic workflow for B to C, illustrating the isolation of fibroblasts from WT1OE mouse lung cultures. Fibroblasts were infected with either control or Cre-expressing adenovirus for 72 hours to induce WT1 overexpression. (B) Fibroblasts were infected with either control adenovirus (AdControl) or Cre-expressing adenovirus (AdCre) for 72 hours, and cell lysates were immunoblotted with antibodies against Wt1, Bak, Bax, αSma, or Gapdh. (C) Schematic workflow for E to I, illustrating the isolation of fibroblasts from lung cultures derived from TGFOEWT1fl/fl mice on doxycycline-treated food for 8 weeks. Lung-resident fibroblasts were infected with either control or Cre-expressing adenovirus for 72 hours to delete WT1. (D) RT-PCR quantification of WT1 and ECM gene transcript expression, including Col1α1, Col1α2, Col3α, Fn1, and Acta2, in WT1-deficient fibroblasts compared with control fibroblasts (n = 3/group). *P < 0.05, **P < 0.01, and ****P < 0.0001, by multiple unpaired, 2-tailed Student’s t tests. (E and F) Lung-resident fibroblasts isolated from lung cultures of TGFOE WT1fl/fl mice on doxycycline-treated food for 8 weeks were infected with either control or Cre-expressing adenovirus for 72 hours, and cell lysates were immunoblotted with antibodies against Wt1, Bcl2, Bcl-XL, Bax, Col1α, Eln, Fn1, αSma, or Gapdh. (G) Fibroblasts were infected with either control or Cre-expressing adenovirus for 48 hours, followed by treatment with anti-Fas for an additional 24 hours. Cells were then stained to quantify TUNEL+ apoptotic cells (yellow arrowheads). Representative confocal images are shown. Original magnification, ×20. Scale bars: 100 μm. (H) Quantification of the percentage of TUNEL+ cells (red) in total cells stained with DAPI (blue) was performed using MetaMorph image analysis (n = 3/group). *P < 0.05 and **P < 0.01, by 1-way ANOVA.
Figure 7
Figure 7. Fibroblast-specific WT1 overexpression augments bleomycin-induced pulmonary fibrosis in mice.
(A) Schematic representation of the animal experiment involving PDGFRαCreERT (control) and PDGFRαCreERT WT1OE (cWT1OE) mice. Mice were treated repeatedly with bleomycin via intratracheal administration and with tamoxifen via intraperitoneal injection. (B) Quantification of Wt1 gene transcripts by RT-PCR in total lung RNA isolated from control and cWT1OE mice (n = 6/group). **P < 0.01, by 2-tailed Student’s t test. (C) Representative confocal images of lung sections from control and cWT1OE mice co-immunostained for WT1 (red), vimentin (green), and DAPI (blue). Scale bars: 20 μm. (D) Representative images of Masson’s trichrome–stained lung sections from control and cWT1OE mice. Original magnification, ×4 and ×20, respectively. Scale bars: 1,500 μm and 200 μm, respectively. (E) The percentage of fibrotic area was quantified in control and cWT1OE mice using BZ-X image analysis (n = 6/group). ****P < 0.0001, by 2-tailed Student’s t test. (F) Hydroxyproline levels were measured in the right lungs of control and cWT1OE mice (n = 6/group). ***P < 0.001, by 2-tailed Student’s t test. (G) Lung resistance was assessed using FlexiVent in control and cWT1OE mice treated with bleomycin (n = 6/group). *P < 0.01, by 2-tailed Student’s t test. (H) Proliferation of fibroblasts was quantified using a BrdU incorporation assay in lung cultures from control and cWT1OE mice treated with bleomycin (n = 3/group). *P < 0.05, by 2-tailed Student’s t test. (I) Fibroblasts from the lung cultures of control and cWT1OE mice treated with bleomycin were treated with anti-Fas antibody for 24 hours, followed by TUNEL staining (red). Representative confocal images are shown; nuclei are stained with DAPI (blue). Original magnification, ×20. Scale bars: 100 μm. (J) Percentage of TUNEL+ fibroblasts in total DAPI+ fibroblasts (n = 3/group). *P < 0.05 and **P < 0.01, by 1-way ANOVA. Data are representative of 2 independent experiments with similar findings.
Figure 8
Figure 8. WT1 augments fibroblast survival and bleomycin-induced pulmonary fibrosis in aged mice.
(A) Schematic presentation of the study using 15-month-old PDGFRαCreERT (control) and PDGFRαCreERT WT1OE (cWT1OE) mice. (B) Quantification of cell-survival gene transcripts (Wt1, Bcl2, Bcl-XL, and Bcl3) in total lung transcripts for control and cWT1OE mice (n = 3/group). **P < 0.01 and ****P < 0.0001, by multiple unpaired, 2-tailed Student’s t test. (C) The total lung lysates were immunoblotted with antibodies against Wt1, Col1α1, Bax, Bcl2, Bcl-XL, and Gapdh for control and cWT1OE mice. (D) Wt1, Col1α1, Bcl2, and Bcl-XL protein levels were normalized to Gapdh (n = 3/group). *P < 0.05, **P < 0.01, and ***P < 0.001, by 2-tailed Student’s t test. (E) Schematic representation of the animal experiment involving 15-month-old PDGFRαCreERT (control) and PDGFRαCreERT WT1OE (cWT1OE) mice. Mice were treated with bleomycin and tamoxifen as shown in the schema. (F) Representative confocal images of lung sections from 15-month-old control and cWT1OE mice. Arrowheads highlight lung fibroblasts that costained for WT1 (red), vimentin (green), and DAPI (blue) in lung sections from control and cWT1OE mice treated with bleomycin. Scale bars: 20 μm. (G) Representative images of Masson’s trichrome-stained lung sections from control and cWT1OE mice treated with bleomycin. Scale bar: 200 μm. (H) The percentage of fibrotic area was quantified in control and cWT1OE mice using BZ-X image analysis (n = 4–5/group). *P < 0.05, by 2-tailed Student’s t test. (I) Hydroxyproline levels were measured in the right lungs from control and cWT1OE mice treated with bleomycin (n = 4–5/group). *P < 0.05, by 2-tailed Student’s t test. (J) Representative images of αSMA-stained lung sections from control and cWT1OE mice treated with bleomycin. Scale bars: 100 μm. (K) Quantification of αSMA+ area in whole lung sections (n = 4–5/group). *P < 0.05, by 2-tailed Student’s t test. Tam, tamoxifen.

Update of

Similar articles

References

    1. Wilson MS, Wynn TA. Pulmonary fibrosis: pathogenesis, etiology and regulation. Mucosal Immunol. 2009;2(2):103–121. doi: 10.1038/mi.2008.85. - DOI - PMC - PubMed
    1. Sontake V, et al. New therapeutics based on emerging concepts in pulmonary fibrosis. Expert Opin Ther Targets. 2019;23(1):69–81. doi: 10.1080/14728222.2019.1552262. - DOI - PMC - PubMed
    1. Sontake V, et al. Wilms’ tumor 1 drives fibroproliferation and myofibroblast transformation in severe fibrotic lung disease. JCI Insight. 2018;3(16):e121252. doi: 10.1172/jci.insight.121252. - DOI - PMC - PubMed
    1. Martinez FJ, et al. Idiopathic pulmonary fibrosis. Nat Rev Dis Primers. 2017;3:17074. doi: 10.1038/nrdp.2017.74. - DOI - PubMed
    1. Maher TM, et al. Global incidence and prevalence of idiopathic pulmonary fibrosis. Respir Res. 2021;22(1):197. doi: 10.1186/s12931-021-01791-z. - DOI - PMC - PubMed