. 2025 Jun 10;135(15):e188792.
doi: 10.1172/JCI188792. eCollection 2025 Aug 1.

Kidney-specific WNK1 amplifies kidney tubule responsiveness to potassium via WNK body condensates

Affiliations

Kidney-specific WNK1 amplifies kidney tubule responsiveness to potassium via WNK body condensates

Cary R Boyd-Shiwarski et al. J Clin Invest. .

Abstract

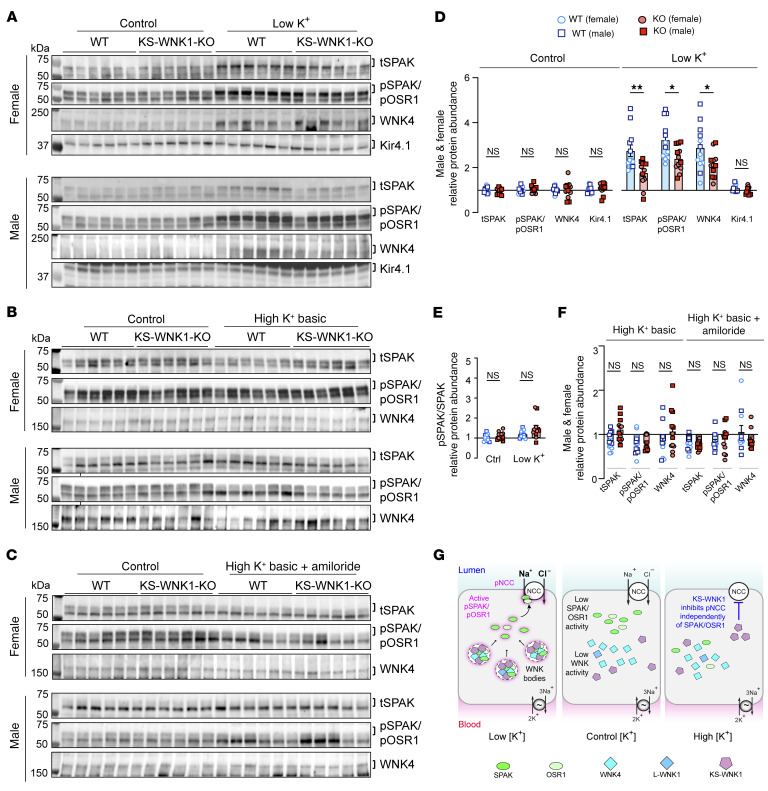
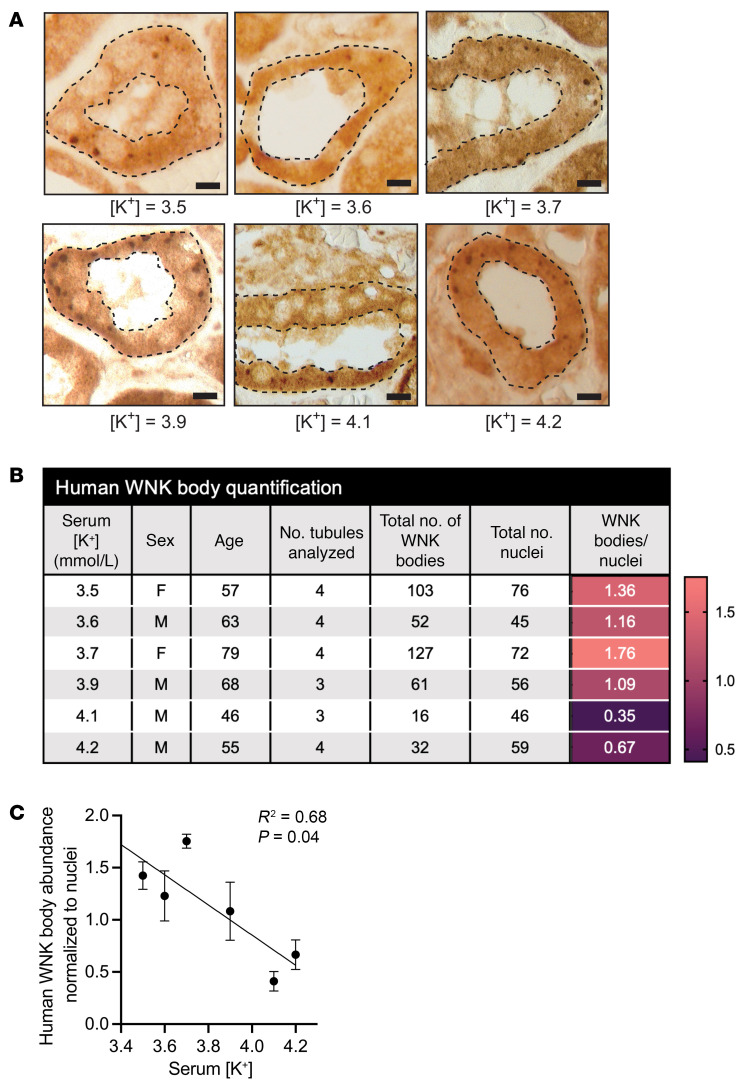
To maintain potassium homeostasis, the kidney's distal convoluted tubule (DCT) evolved to convert small changes in blood [K+] into robust effects on salt reabsorption. This process requires NaCl cotransporter (NCC) activation by the with-no-lysine (WNK) kinases. During hypokalemia, the kidney-specific WNK1 isoform (KS-WNK1) scaffolds the DCT-expressed WNK signaling pathway within biomolecular condensates of unknown function termed WNK bodies. Here, we show that KS-WNK1 amplified kidney tubule reactivity to blood [K+], in part via WNK bodies. In genetically modified mice, targeted condensate disruption trapped the WNK pathway, causing renal salt wasting that was more pronounced in females. In humans, WNK bodies accumulated as plasma potassium fell below 4.0 mmol/L, suggesting that the human DCT experiences the stress of potassium deficiency, even when [K+] is in the low-to-normal range. These data identify WNK bodies as kinase signal amplifiers that mediate tubular [K+] responsiveness, nephron sexual dimorphism, and BP salt sensitivity. Our results illustrate how biomolecular condensate specialization can optimize a mammalian physiologic stress response that impacts human health.

Keywords: Cell biology; Epithelial transport of ions and water; Molecular biology; Nephrology; Protein kinases.


Conflict of interest statement

Conflict of interest: The authors have declared that no conflict of interest exists.

Figures

Figure 1
Figure 1. KS-WNK1 is a DCT-specific disordered protein that drives WNK body condensate formation.
(A) Schematic representation of the WNK1 gene. A ubiquitously expressed promoter drives L-WNK1 transcription. A distal tubule–specific promoter drives the expression of the truncated KS-WNK1 isoform. Figure numbers represent exons 1-28. (B) Domain architecture of L- and KS-WNK1 isoforms. Full-length long WNK1 contains an N-terminal domain (NTD), a serine-threonine kinase domain (green), and a >100 kDa intrinsically disordered C-terminal domain (CTD) that drives condensate formation (17). Other functional signatures include SPAK/OSR1 binding motifs (yellow), coiled-coil domains (purple), and prion-like regions (pink). KS-WNK1 lacks the NTD and most of the kinase domain, which was replaced by a 30-amino acid sequence encoded by exon 4a (red). Figure numbers represent amino acids (amino acid 1-2382 for L-WNK1 and amino acid 1-1975 for KS-WNK1). Schematics adapted with permission from Boyd-Shiwarski et al. (12). (C) Illustration (left) and immunofluorescence (IF) staining (right) of WNK bodies, which form in NCC-expressing DCT cells during hypokalemia. KS-WNK1–KO mice fail to form WNK bodies. Scale bar: 15 μm. (D) Alphafold3 predictions of L-WNK1 and KS-WNK1, highlighting their extensive disorder. The green structured region in L-WNK1 is the kinase domain, and the red structured region in KS-WNK1 is exon 4a.
Figure 2
Figure 2. KS-WNK1 differentially alters NCC abundance and phosphorylation during hypo- and hyperkalemia.
(AC) Immunoblot analysis of kidney cortical extracts from female and male WT littermates and KS-WNK1–KO mice subjected to 10-day maneuvers that alter K+ homeostasis. Immunoblots of total NCC (tNCC) and active phospho-Thr53 NCC (pNCC), from female and male mice fed control diet (Ctrl) or (A) low K+ (LK), (B) high K+ basic (HKB), or (C) HKB + amiloride (HKB + amil) (2 mg/kg/d) diet. In A and B, lanes corresponding to WT and KO animals on control diet were from replicate lysates to facilitate normalization between blots. The average from these replicates was plotted for control diet (Supplemental Figure 2). Additional values for WT and KO mice on control diet were obtained from Figure 2C. (D and E) KS-WNK1 had no significant effect on tNCC abundance, regardless of sex. (F and G) KS-WNK1 had significant effects on pNCC during LK and HKB+amiloride treatments. (H) These data indicate that KS-WNK1 stimulates NCC during hypokalemia and inhibits during hyperkalemia. Results are shown as mean ± SEM; n = 5–6 mice per genotype, sex, and diet, except control diet n = 8–10 mice. M, male; F, female. Two-way ANOVA with Šídák’s multiple comparisons test. *P ≤ 0.05, **P ≤ 0.01. For DG, data were normalized to WT mice on control diet, as indicated by #.
Figure 3
Figure 3. KS-WNK1 amplifies the inverse relationship between NCC phosphorylation and blood [K+].
Total and phosphorylated NCC protein abundance in KS-WNK1–KO (red) versus WT (blue) mice, plotted as a function of blood [K+]. (AC) tNCC, pNCC, and pNCC /tNCC ratio, fit to single exponential curves. R2 measures are presented in table format alongside the graphs. For all graphs, the single exponential function adequately fit the WT data at [K+] <4.0 but overestimated data points at [K+] >6.0 (filled blue circles). (DF) Normalized tNCC, pNCC, and pNCC/tNCC densitometry in AC was log transformed and analyzed by linear regression. In all cases, WT data were best fit by a segmented linear regression regime, with X0 breakpoints (dotted line) around 5.6 mmol/L. Slopes of the 2 linear components are presented in table format alongside the corresponding graphs. For KO mice, slopes 1 (X < X0) and 2 (X > X0) did not differ as the log-transformed data were best fit by simple linear regression. P values represent slope comparisons between WT and KO data; since slope 1 comparisons did not reach significance, Y-intercept comparisons with P values are shown. See also Supplemental Figure 5 for results disaggregated by sex and residual plots.
Figure 4
Figure 4. WNK body condensate expression is dependent upon blood [K+] and correlates with pNCC amplification during potassium deficiency.
(A) IF of WNK bodies in WT male mice treated with various potassium maneuvers for 10 days to induce a broad range of blood K+ concentrations. DCTs were identified by NCC costaining. WNK4+ puncta progressively increased in size as [K+] fell and were not visible above a [K+] of 4.0. Scale bar: 10 μm (B) Quantification of WNK body size as a function of blood [K+], fit to a single exponential curve; R2 = 0.9757, P < 0.0001 vs. a horizontal line through the mean of Y values. This demonstrates a WNK body size dependence on [K+]. (C) Cropped and adapted image from Figure 3B integrated with WNK body expression and pNCC amplification. As [K+] falls below 4.0 mmol/L, WT mice amplify NCC phosphorylation more effectively than KS-WNK1–KO mice, correlating with WNK body expression. (D) CLEM of a semithin (~300 nm) DCT section in a hypokalemic WT mouse combining confocal with backscattered-electron scanning electron microscopy (BSE-SEM). WNK bodies were detected with a WNK1 primary and a dual Alexa Fluor 488/5 nm gold particle–conjugated secondary. The image is inverted; thus, areas of low signal intensity represent lower BSE reflectivity. WNK body condensates contained immunogold signal that clustered within membraneless perinuclear cytosolic regions of lower material density. Scale bar: 200 nm.
Figure 5
Figure 5. Dysregulated WNK4-SPAK/OSR1 pathway activity in KS-WNK1–KO mice during K+ restriction, but not during K+ loading.
Immunoblot analysis of kidney cortical extracts from female and male WT littermates and KS-WNK1–KO mice subjected to various K+ maneuvers for 10 days. (AC) Immunoblot of the WNK-SPAK/OSR1 pathway from mice treated with control diet or (A) low K+ diet, (B) HKB diet, or (C) HKB + amiloride. Brackets indicate the band analyzed. In AC, lanes corresponding to WT and KO animals on control diet were from replicate lysates to facilitate normalization between blots. The values graphed for control diet in Figures D and E represent an average of the replicates (Supplemental Figure 6). (D) WT mice fed a low K+ diet had significant increases in tSPAK, pSPAK/pOSR1, and WNK4 compared with WT mice on control diet. KS-WNK1–KO mice had a blunted response to the low K+ diet compared with WT mice. (E) Phosphorylated-to-total SPAK ratio in WT and KO mice subjected to control vs. low K+ diet. (F) No differences in WNK4-SPAK/OSR1 pathway abundance or phosphorylation in WT and KS-WNK1–KO mice subjected to HKB or HKB + amiloride treatment. (G) WNK-SPAK/OSR1 pathway activation during low, control, and high blood [K+] experimental maneuvers. During low [K+], KS-WNK1–dependent WNK bodies condense the WNK-SPAK/OSR1 pathway; this correlates with SPAK/OSR1 and NCC phosphoactivation. During high K+, KS-WNK1 inhibits pNCC activation independently of the SPAK/OSR1 pathway. Results are shown as mean ± SEM; n = 12 mice per genotype and diet (males and females combined). Two-way ANOVA with Šídák’s multiple comparisons test, *P ≤ 0.05, **P ≤ 0.01.
Figure 6
Figure 6. K+-restricted WT and KS-WNK1–KO mice exhibit sex differences in WNK body expression.
(A) IF of kidney sections from WT or KS-WNK1–KO mice treated with low K+ diet for 10 days. DCTs were identified by NCC costaining and morphology. WNK4, pSPAK/pOSR1, and WNK1 antibodies colocalized within puncta in WT mice, whereas puncta were nearly absent in KS-WNK1–KO mice (duplicate bottom left image with Figure 1C). Scale bars: 15 μm. (B) WNK body formation in female WT and KS-WNK1–KO mice. Cytosolic puncta are largely absent in KS-WNK1–KO mice, though pSPAK/pOSR1 apical staining is present. Rarely, mislocalized basolateral puncta containing pSPAK/pOSR1 and WNK4 were observed (arrowheads). Scale bar: 15 μm. (C) Imaris was used to quantify WNK body number and size (middle) and distance to lumen (right) from raw confocal IF images of pSPAK/pOSR1 puncta (left). Scale bar: 4 μm. (DF) Quantification of pSPAK/pOSR1. (D) Puncta per cell (20 tubules per condition), (E) puncta diameter (5 tubules per condition), and (F) distance to apical lumen in female and male mice (5 tubules per condition). Two-way ANOVA with Šídák’s multiple comparison, *P ≤ 0.05, **P ≤ 0.01, ***P ≤ 0.001, ****P ≤ 0.0001.
Figure 7
Figure 7. Effect of KS-WNK1 on blood and urine composition in K+-restricted female and male mice.
Male and female whole blood electrolytes and urine were obtained from WT and KS-WNK1–KO mice fed low K+ diets for 10 days. Results were analyzed as both combined and sex-disaggregated. (A) KS-WNK1–KO mice had significantly increased blood [Na+] when males and females were analyzed in combination and when females were analyzed separately. (B) Urine osmolality in KS-WNK1–KO mice was significantly decreased in the combined male and female dataset and in the female pool. Mean urine osmolality in KS-WNK1–KO males was lower than in male WT mice, without reaching significance. (C) KS-WNK1 deletion had no significant effect on whole blood [K+] in the combined pool or in the male pool. However, female KS-WNK1–KO mice had a significant decrease in whole blood [K+] compared with sex-matched controls. (D) KS-WNK1 deletion had no significant effect on whole blood [Ca2+] in the combined male and female pool or in the female pool. However, male KS-WNK1–KO mice had a significant increase in whole blood [Ca2+]. Sample size: n = 10–18 mice. Unpaired t test between WT and KO was used to determine significance, *P ≤ 0.05, **P ≤ 0.01.
Figure 8
Figure 8. Potassium-restricted KS-WNK1–KO mice are thiazide insensitive.
(A) Schematic of the BP telemetry experiment. Female WT (n = 4) and KS-WNK1–KO mice (n = 6) were subjected to either low K+ or control diets for 10 days, followed by supplementation with 1% normal saline in drinking water for 3 days and then hydrochlorothiazide (HCTZ) treatment. (B) KS-WNK1 expression had no significant effect on mean arterial pressure (MAP) in K+-restricted or control diet–fed mice. Saline supplementation increased MAP in K+-restricted mice. Genotype had no significant effect determined by 2-way ANOVA with post hoc Šídák’s test. Each data point represents either daytime or nighttime MAP averaged over 6 hours. (C) Thiazide challenge. Mice were fed low K+ or control diet for 10 days and then 1% saline in their drinking water for 3 days. Daytime MAP was measured for a 6-hour window, starting on day 14 (24 hours before HCTZ injection) and on day 15 (1 hour after HCTZ injection) (25 mg/kg IP). WT mice on low K+ diet had a significant decrease in MAP with HCTZ administration, compared with KS-WNK1–KO mice. *P ≤ 0.05, 2-way ANOVA with post hoc Šídák’s test. (D) Schematic of the metabolic cage experiment. Diuretic challenge was performed in both female and male WT and KS-WNK1–KO mice. After 10 days of control or low K+ diet, mice were injected with HCTZ (25 mg/kg IP), and urine was collected for 6 hours. (E) Urine volume and (F) urine Na+V were greater in WT mice compared with those in KO mice. (G) On the low K+ diet, urine K+ was too low to detect a significant difference. (H) There was a trend for HCTZ to blunt Cl excretion in KS-WNK1–KO mice on low K+ diet, without reaching significance. Results are shown as mean ± SEM; n = 12 mice per genotype and diet. Two-way ANOVA with Šídák’s post test; *P ≤ 0.05, **P ≤ 0.01. See also Supplemental Tables 2 and 3.
Figure 9
Figure 9. KS-WNK1 5Q mutant mice exhibit altered WNK body morphology and pSPAK localization.
(A) Exon 4a of KS-WNK1 encodes a 30-amino acid sequence, including a cysteine-rich hydrophobic (CRH) motif. The motif’s 5 consecutive bulky hydrophobic residues were mutated to glutamines to generate “5Q” mice with aberrant WNK body formation. (B) AlphaFold predicted structures of the WT and 5Q exon 4a peptide (red) and the adjacent remnant kinase domain (cyan). The 5Q mutation disrupts a predicted helical structure encoded by exon 4a. (C) IF of kidneys from female 5Q mice maintained on low K+ diet for 10 days. Typical WNK bodies are absent and replaced by irregularly shaped foci that often form paranuclear crescents and contain WNK4 and pSPAK/pOSR1. Scale bar: 10 μm. (D) The morphology of the 5Q foci was less round and larger than WT WNK bodies. n = 425 foci from 9 images for WT, 530 from 12 images for 5Q; 2-tailed t test, ****P < 0.0001. (E) WNK4 and pSPAK/pOSR1 costaining in WT and 5Q mice. In WT mice, pSPAK/pOSR1 signal colocalized with WNK4 in puncta and was also located at the DCT apical membrane. In contrast, 5Q mice exhibited strong pSPAK/pOSR1 and WNK4 co-condensation in perinuclear aggregates but no apical pSPAK/pOSR1. Scale bar: 30 μm. (F) Higher magnification image of WNK4 and activated SPAK/OSR1 expression. White arrowheads highlight that, in WT mice, pSPAK/pOSR1 accumulates at the plasma membrane, but in 5Q mice, it becomes sequestered in irregularly shaped, generally subnuclear foci. Scale bar: 10 μm.
Figure 10
Figure 10. WNK bodies are necessary for KS-WNK1 to amplify NCC phosphorylation during hypokalemia.
(A) WT and 5Q mice were fed control or low K+ diet for 10 days, and kidney cortex homogenates were probed for tNCC, pNCC, tSPAK, and pSPAK/pOSR1. Brackets indicate the band analyzed. (BE) Graphical representation of immunoblots in A. (B) tNCC abundance. (C) pNCC abundance. (D) tSPAK abundance. (E) pSPAK/pOSR1 abundance. K+-restricted 5Q mice had significantly increased pSPAK/pOSR1 and reduced tNCC and pNCC expression, indicating that signaling to NCC was uncoupled. n = 6 mice per genotype, sex, and diet. Two-way ANOVA with Šídák’s post test was applied, *P < 0.05, **P < 0.01, ***P ≤ 0.001, ****P ≤ 0.0001. (F) Model of WNK-SPAK/OSR1-NCC signaling in WT, KS-WNK1–KO, and 5Q mice. KS-WNK1 normally facilitates WNK body condensate formation and NCC activation via the WNK-SPAK/OSR1 pathway. In K+-restricted KS-WNK1–KO mice, WNK bodies are largely absent and remaining complexes are mislocalized, resulting in low SPAK/OSR1 and NCC activity. In the K+-restricted 5Q mouse, WNK-pSPAK/pOSR1 becomes trapped in perinuclear aggregates, preventing pSPAK/pOSR1 expression at the DCT apical membrane, causing a reduction in NCC activity. See also Supplemental Table 4.
Figure 11
Figure 11. Human WNK body abundance correlates with serum [K+].
(A) Immunohistochemistry of DCTs obtained from 6 human kidney wedge biopsies stained for WNK1. DCTs were confirmed by NCC staining in adjacent sections (not shown). Scale bar: 10µm. (B) Serum [K+], sex, and age of the participants, along with the values used for quantification. A heatmap indicates the correlation between WNK bodies and increasing serum [K+]. (C) There was an inverse relationship between serum [K+] and WNK body abundance. To calculate the average number of WNK bodies per cell, the number of WNK bodies within a single tubule was counted and then normalized to the number of nuclei within that tubule. Each data point represents the average number of WNK bodies per kidney analyzed; n = 3–4 tubules analyzed per kidney. Slope of –1.446 calculated using simple linear regression. Results are shown as mean ± SEM; r2 = 0.68, P = 0.04 vs. horizontal line.

Comment in

  • KS-WNK1 augments the effects of dietary potassium intake on renal sodium chloride reabsorption

References

    1. Boyd-Shiwarski CR, Subramanya AR. The renal response to potassium stress: integrating past with present. Curr Opin Nephrol Hypertens. 2017;26(5):411–418. doi: 10.1097/MNH.0000000000000352. - DOI - PMC - PubMed
    1. Terker AS, et al. Potassium modulates electrolyte balance and blood pressure through effects on distal cell voltage and chloride. Cell Metab. 2015;21(1):39–50. doi: 10.1016/j.cmet.2014.12.006. - DOI - PMC - PubMed
    1. Hoorn EJ, et al. Regulation of the renal NaCl cotransporter and its role in potassium homeostasis. Physiol Rev. 2020;100(1):321–356. doi: 10.1152/physrev.00044.2018. - DOI - PubMed
    1. Sorensen MV, et al. Rapid dephosphorylation of the renal sodium chloride cotransporter in response to oral potassium intake in mice. Kidney Int. 2013;83(5):811–824. doi: 10.1038/ki.2013.14. - DOI - PubMed
    1. Picard N, et al. Protein phosphatase 1 inhibitor-1 deficiency reduces phosphorylation of renal NaCl cotransporter and causes arterial hypotension. J Am Soc Nephrol. 2014;25(3):511–522. doi: 10.1681/ASN.2012121202. - DOI - PMC - PubMed